. 2010 Aug 24:6:403.
doi: 10.1038/msb.2010.45.

Structured digital tables on the Semantic Web: toward a structured digital literature

Affiliations

Structured digital tables on the Semantic Web: toward a structured digital literature

Kei-Hoi Cheung et al. Mol Syst Biol. .

Abstract

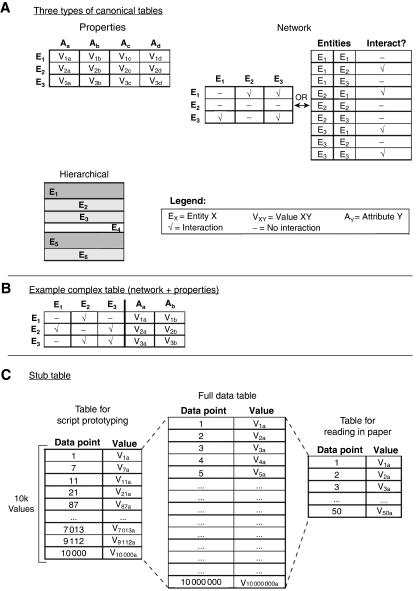
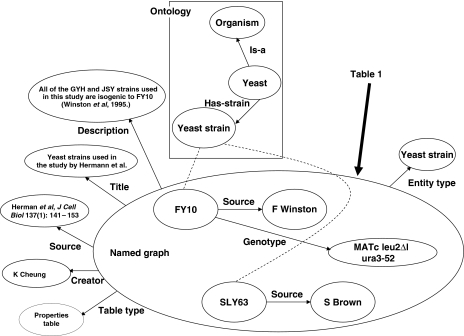
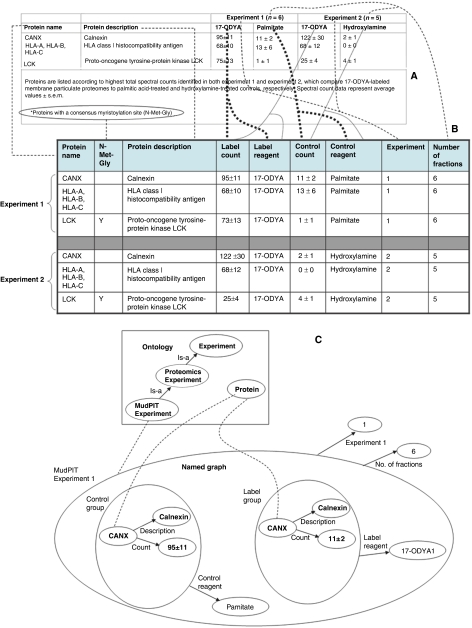
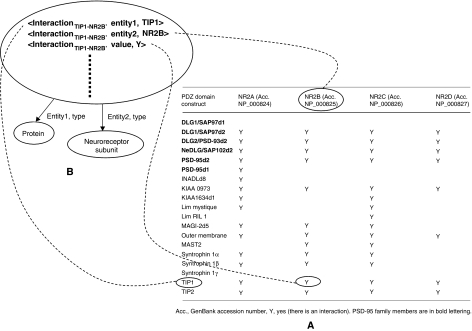
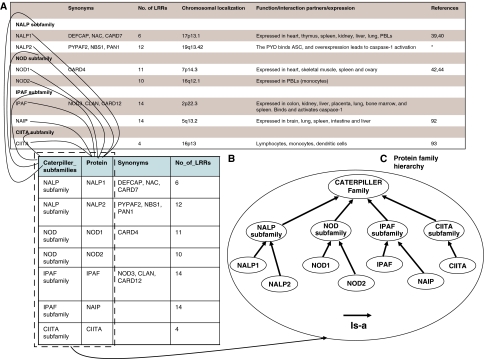
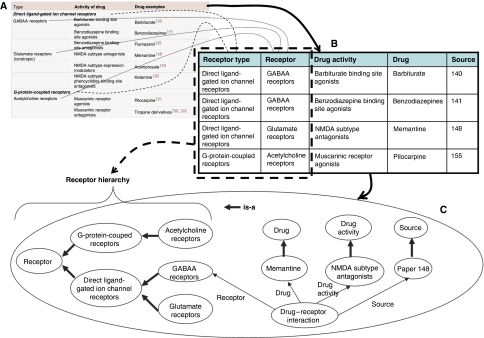
In parallel to the growth in bioscience databases, biomedical publications have increased exponentially in the past decade. However, the extraction of high-quality information from the corpus of scientific literature has been hampered by the lack of machine-interpretable content, despite text-mining advances. To address this, we propose creating a structured digital table as part of an overall effort in developing machine-readable, structured digital literature. In particular, we envision transforming publication tables into standardized triples using Semantic Web approaches. We identify three canonical types of tables (conveying information about properties, networks, and concept hierarchies) and show how more complex tables can be built from these basic types. We envision that authors would create tables initially using the structured triples for canonical types and then have them visually rendered for publication, and we present examples for converting representative tables into triples. Finally, we discuss how 'stub' versions of structured digital tables could be a useful bridge for connecting together the literature with databases, allowing the former to more precisely document the later.


Conflict of interest statement

The authors declare that they have no conflict of interest.

Figures

Figure 1
Figure 1
(A) Three types of canonical tables. (B) A complex table consisting of network and properties tables. (C) Stub tables: a small one (listing the top 50 rows of the full table) for reading in paper and a medium one (consisting of 10 000 randomly selected rows from the full table) for scripting purposes.
Figure 2
Figure 2
Conversion of Table I into triples contained in a named graph. Source data is available for this figure at www.nature.com/msb.
Figure 3
Figure 3
(A) A published table featuring a repeated group of columns (experiment 1 and experiment 2; Martin and Cravatt, 2009, reproduced with permission, Nature Methods © 2009). (B) The corresponding canonical tables featuring some restructure of the published table. For example, two canonical tables are derived from the single-published table according to the two experiments. As described in the paper, 17-ODYA is the name of the reagent that was used for labeling the sample, whereas palmitate and hydroxylamine are the names of the reagents used for treating the controls, additional columns are created in the canonical table for storing these reagent names. (C) Triple graph representation of the common table. Notice that separate named graphs are defined for the control and label groups (of identified proteins), with the reagent property associating with each named graph. This approach helps reduce the number of triples (the reagent property does not need to be defined for each identified protein). Source data is available for this figure at www.nature.com/msb.
Figure 4
Figure 4
(A) PDZ domain-containing protein and NMDA receptor subunit interactions (Cui et al, 2007, reproduced with permission Journal of Neuroscience © 2007). (B) A set of triples (triple graph) corresponding to the interaction between TIP1 and NR2B. Source data is available for this figure at www.nature.com/msb.
Figure 5
Figure 5
(A) A published table listing the caterpiller subfamilies of proteins involved in inflammation. (B) A portion of the corresponding canonical tables showing the two columns (caterpiller subfamilies and protein) extracted from the synonyms column of the published table (Tschopp et al, 2003, reproduced with permission Nat Rev Mol Cell Biol © 2003). (C) The hierarchical graph structure of the caterpiller protein families/subfamilies. Source data is available for this figure at www.nature.com/msb.
Figure 6
Figure 6
(A) A published table listing different drugs and their activities on different categories of receptors (Imming et al, 2006, reproduced with permission Nat Rev Drug Discov © 2006). (B) The corresponding canonical table. (C) The ontology graph is created based on the canonical table (the RDF representation of the graph is available in Supplementary information). Source data is available for this figure at www.nature.com/msb.

Similar articles

Cited by

References

    1. Ahmed A, Xing E, Cohen W, Murphy R (2009) Structured correspondence topic models for mining captioned figures in biological literature. Proc 15th ACM SIGKDD Int Conf Knowledge Discov Data Mining, pp 39–47 - PMC - PubMed
    1. Berners-Lee T, Hendler J, Lassila O (2001) The Semantic Web. Sci Am 284: 34–43 - PubMed
    1. Brazma A, Hingamp P, Quackenbush J, Sherlock G, Spellman P, Stoeckert C, Aach J, Ansorge W, Ball C, Causton H, Gaasterland T, Glenisson P, Holstege F, Kim I, Markowitz V, Matese J, Parkinson H, Robinson A, Sarkans U, Schulze-Kremer S et al. (2001) Minimum information about a microarray experiment (MIAME)—toward standards for microarray data. Nat Genet 29: 365–371 - PubMed
    1. Bug WJ, Ascoli GA, Grethe JS, Gupta A, Fennema-Notestine C, Laird AR, Larson SD, Rubin D, Shepherd GM, Turner JA, Martone ME (2008) The NIFSTD and BIRNLex vocabularies: building comprehensive ontologies for neuroscience. Neuroinformatics 6: 175–194 - PMC - PubMed
    1. Carroll J, Bizer C, Hayes P, Stickler P (2005) Named graphs. Web Semant 3: 247–267

Publication types