. 2010 Aug 24:6:405.
doi: 10.1038/msb.2010.55.

A model of yeast cell-cycle regulation based on multisite phosphorylation

Affiliations

A model of yeast cell-cycle regulation based on multisite phosphorylation

Debashis Barik et al. Mol Syst Biol. .

Abstract

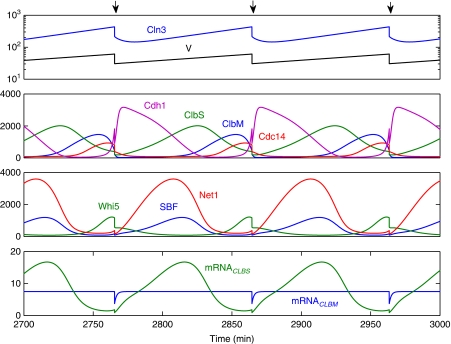
In order for the cell's genome to be passed intact from one generation to the next, the events of the cell cycle (DNA replication, mitosis, cell division) must be executed in the correct order, despite the considerable molecular noise inherent in any protein-based regulatory system residing in the small confines of a eukaryotic cell. To assess the effects of molecular fluctuations on cell-cycle progression in budding yeast cells, we have constructed a new model of the regulation of Cln- and Clb-dependent kinases, based on multisite phosphorylation of their target proteins and on positive and negative feedback loops involving the kinases themselves. To account for the significant role of noise in the transcription and translation steps of gene expression, the model includes mRNAs as well as proteins. The model equations are simulated deterministically and stochastically to reveal the bistable switching behavior on which proper cell-cycle progression depends and to show that this behavior is robust to the level of molecular noise expected in yeast-sized cells (approximately 50 fL volume). The model gives a quantitatively accurate account of the variability observed in the G1-S transition in budding yeast, which is governed by an underlying sizer+timer control system.


Conflict of interest statement

The authors declare that they have no conflict of interest.

Figures

Figure 1
Figure 1
Molecular mechanism for cell-cycle control in budding yeast. A solid arrow represents a chemical reaction and a dotted arrow represents an enzymatic activity on a reaction. Dashed arrows represent multisite phosphorylation chains. A T-shaped arrow with balls on the cross bar indicates a reversible binding reaction. Parameter values for multisite phosphorylation/dephosphorylation of regulatory proteins: for Whi5, N=6 and q=2; for SBF, N=4 and q=0; for Cdh1, N=10 and q=0; for Net1, N=8 and q=5. Hi5, Hbf and Ht1 are three unregulated phosphatases, which oppose cyclin-dependent kinases on the Whi5, SBF and Net1 phosphorylation chains, respectively. The synthesis and degradation reactions of Whi5, SBF, Cdh1, Net1, Hbf, Hi5 and Ht1 are not shown here. The diagram includes synthesis and degradation of MbS, the mRNA for ClbS, which is the only regulated mRNA species in the model. The mRNAs encoding all other proteins in the model are assumed to be synthesized and degraded by simple birth-death processes.
Figure 2
Figure 2
One-parameter bifurcation diagrams. (A) Number of ClbM molecules per cell as a function of (fixed) cell volume. Black line: stable steady state; red line: unstable steady state; blue lines: maximum and minimum levels during a stable limit cycle oscillation. The steady-state curve shows a region of multiple steady states between two saddle-node (SN) bifurcations at V=23.8 and 32.3 fL, and a Hopf bifurcation (HB) at V=23.9 fL. (B) Period of limit cycle oscillation (dashed line) is overlaid on top of bifurcation diagram.
Figure 3
Figure 3
Deterministically simulated time courses of some key regulatory species in the cell-cycle control system. Top panel: blue curve is the number of Cln3 molecules per cell and black curve is cell volume in fL. Arrows indicate times of cell division. Other panels plot numbers of molecules per cell for the indicated proteins.
Figure 4
Figure 4
Cell-cycle pedigree generated from a representative stochastic simulation.
Figure 5
Figure 5
Stochastic simulation of the budding yeast cell cycle. (A) Time courses of some key regulatory proteins. (B) Cell-cycle trajectories (blue line) superimposed on the bifurcation diagram (Figure 2). Arrows show the direction of progress through the cell cycle and the abrupt jump from right to left indicates a cell-division event. A cell-cycle trajectory is the locus of [ClbM](t) (the blue line in panel A) versus V(t), plotted parametrically in time from cell birth to cell division. A newborn cell starts at the left end of a jump, and follows the blue trajectory until it reaches cell division, at the right end of the next jump. At each division, the newborn daughter cell receives 40% of the size of the dividing mother cell.
Figure 6
Figure 6
Correlation of αTG1 with ln(Vbirth) for (A, B) daughter cells and (C, D) mother cells. Vbirth is normalized by average volume of daughter cells at birth. (A, C) Black dots are raw data from simulation. Red circles represent data binned in 2 fL intervals. (B, D) Binned data (filled black circles) are fitted well by two straight lines (red).
Figure 7
Figure 7
Correlation of αT1 with ln(Vbirth) for daughter cells, as in Figure 6. (A) Raw data. (B) Binned data (2fL intervals).
Figure 8
Figure 8
Simulated values of αTG1 (blue circles) and αT1 (green circles) for daughter cells are binned and plotted against ln(Vbirth). Solid lines represent best bilinear fits.
Figure 9
Figure 9
Histograms of representative mRNAs (AC) and proteins (DI) in mother cells.
Figure 10
Figure 10
Effect of ploidy on noise. Plot of coefficient of variation (CV) for various cell-cycle properties as a function of ploidy. Blue squares: simulated data; red circles: experimental data, from Supplementary Table S8 of Di Talia et al (2007). Black lines represent expected dependence of CV on formula image
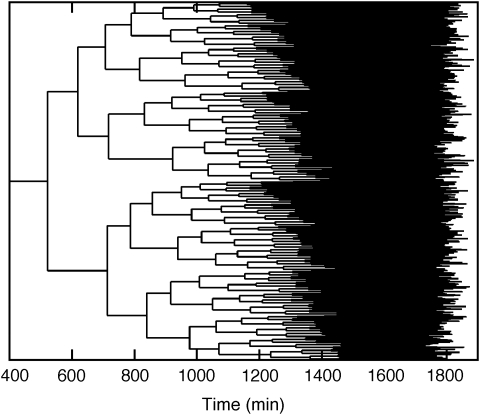
ploidy. Left panel: daughter cells; right panel: mother cells, except for last row.
Figure 11
Figure 11
Variation of protein noise with mean abundance. From an asynchronous population of mother and daughter cells, we picked a sample of cells from a narrow range of volumes around the mean cell size (mean±1 fL). This procedure mimics the ‘gating’ method that Newman et al (2006) used to reduce extrinsic noise. We calculated the mean and coefficient of variation of every protein in this sample of cells. For proteins with multiple phospho-forms (SBF, Whi5, Cdh1 and Net1) and/or bound in complexes (Cdc14, Net1, SBF and Whi5), we computed the mean and CV for the total population of each protein. We include data for haploid, diploid and tetraploid cells in the same plot.
Figure 12
Figure 12
Correlation of αT1 with log(Vbirth) for mother (red) and daughter (blue) cells. Left panels: at division, Cln3 is distributed 25:75 to the daughter and mother cells, which is representative of the situation in wild-type (WT) cells. Right panels: at division, Cln3 is distributed 50:50 to daughter and mother cells, which is representative of the situation in ACE2* ASH1* mutant cells (Di Talia et al, 2009). In the lower panels, we replot the data by randomly picking 50 data points (both for daughter and mother cells) from the respective upper panel plots, so that the correlation can be compared more easily with the experimental plots (Figure 2A and G) in Di Talia et al (2009). In our simulations, the average T1 delay between daughter and mother cells of the same birth size is 11.5 min in WT cells and 1.14 min in mutant cells. In the experiments of Di Talia et al, these delays are 8 and 1.3 min, respectively.

References

    1. Amon A, Tyers M, Futcher B, Nasmyth K (1993) Mechanisms that help the yeast cell cycle clock tick: G2 cyclins transcriptionally activate G2 cyclins and repress G1 cyclins. Cell 74: 993–1007 - PubMed
    1. Arava Y, Wang Y, Storey JD, Liu CL, Brown PO, Herschlag D (2003) Genome-wide analysis of mRNA translation profile in Saccharomyces cerevisiae. Proc Natl Acad Sci USA 100: 3889–3894 - PMC - PubMed
    1. Azzam R, Chen SL, Shou WY, Mah AS, Alexandru G, Nasmyth K, Annan RS, Carr SA, Deshaies RJ (2004) Phosphorylation by cyclin B-CDK underlies release of mitotic exit activator Cdc14 from the nucleolus. Science 305: 516–519 - PubMed
    1. Belle A, Tanay A, Bitincka L, Shamir R, O’Shea EK (2006) Quantification of protein half-lives in the budding yeast proteome. Proc Natl Acad Sci USA 103: 13004–13009 - PMC - PubMed
    1. Braunewell S, Bornholdt S (2007) Superstability of the yeast cell-cycle dynamics: ensuring causality in the presence of biochemical stochasticity. J Theor Biol 245: 638–643 - PubMed

Publication types

Substances