. 2011 Mar;5(3):519-31.
doi: 10.1038/ismej.2010.129. Epub 2010 Aug 26.

Unveiling an abundant core microbiota in the human adult colon by a phylogroup-independent searching approach

Affiliations

Unveiling an abundant core microbiota in the human adult colon by a phylogroup-independent searching approach

Monika Sekelja et al. ISME J. 2011 Mar.

Abstract

The potential presence of widespread and stable bacterial core phylogroups in the human colon has promoted considerable attention. Despite major efforts, no such phylogroups have yet been identified. Therefore, using a novel phylogroup- and tree-independent approach, we present a reanalysis of 1,114,722 V2 region and 71,550 near full-length 16S rRNA sequences from a total of 210 human beings, with widespread geographic origin, ethnic background and diet, in addition to a wide range of other mammals. We found two highly prevalent core phylogroups (cores 1 and 2), belonging to the clostridial family Lachnospiraceae. These core phylogroups showed a log-normal distribution among human individuals, while non-core phylogroups showed more skewed distributions towards individuals with low levels compared with the log-normal distribution. Molecular clock analyses suggest that core 2 co-evolved with the radiation of vertebrates, while core 1 co-evolved with the mammals. Taken together, the stability, prevalence and potential functionality support the fact that the identified core phylogroups are pivotal in maintaining gut homeostasis and health.


Figures

Figure 1
Figure 1
Graphical representation of core searching approach. (a) Square with low core potential and (b) square with high core potential. Each colour in the plot represents one specific category. The PCA map is divided into small grid squares of equal size. With centre point in the middle of each grid square, the smallest radius needed to include bacteria from all different individuals is found. The bacterial clones located in each grid square are assigned a value, defined as ‘core potential', based on the value of the smallest radius. The smaller the radius, the higher the ‘core potential'. The areas with highest ‘core potential' values are investigated further as the potential core bacterial phylogroups. The core potential (cp) of the data points in the grid placed in the centre of the circles is (a) 1—r1/rmax and (b) 1—r2/rmax, where rmax is a scaling factor. Thus, the grid with the densest clustering of different categories has the highest core potential.
Figure 2
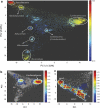
Figure 2
PCA plot of gene phylogeny constructed using AIBIMM method, here presented by the first two principal components of the model. Each data point corresponds to one 16S rRNA gene clone. The labels describing different phylogroups are for descriptive purposes only (no real/statistical taxonomic group assignment). Supplementary Table S4 gives an overview of sequence names, their best matches in RDP10 database and PCA coordinates. (a) The data points are coloured according to their explained variance, that is, how well the PCA model is describing them. The explained variance for a data point is high when its model approximation value complies well with its observed value. (b) Grid-based search reveals potential core areas. The data points having cp value below cpmean are greyed out. The colour scale ranges from red (cpmax) to blue (cpcpmean). Lachnospiraceae core group (40% of the total data points count) was extracted as a sub-data set and further analysed to find more specific core groups, cores 1 and 2, as shown in (c).
Figure 3
Figure 3
Phylogenetic reconstruction of sequences belonging to cores 1 and 2. One hundred sequences were chosen randomly from each core phylogroup, three from Faecalibacteria and Bacteroides and six from each of the manually derived bacterial outgroups: Lachnospiraceae outgroup 1 (yellow) and Lachnospiraceae outgroup 2 (blue). Sequence alignment was performed using RDP10 aligner (Cole et al., 2009). The neighbour-joining tree was constructed using program Mega 4.1, and 12 with default parameters. Dendroscope (Huson et al., 2007) made it possible to draw the tree as circular phylogram and to colour the labels. Detailed description is available in Supplementary Figure S5. The name of the each sequence consists of the phylogroup name, coordinates in PCA plot Figure 2a and closest match in RDP10 database. The majority of core 2 sequences have highest match to Dorea in RDP10 database, while most core 1 sequences are described either as Lachnospiraceae Incertae Sedis (LIS) or uncultured Lachnospiraceae. Representatives from Lachnospiraceae outgroup 1 shared high similarity to Roseburia (Roseb).
Figure 4
Figure 4
Relative abundance of the five bacterial phylogroups within each individual for each time point. The normalization was performed per individual per phylogroup (Equation (4)). The mean value for each time point for each phylogroup is outlined with the star symbol. The colouring distinguishes between the two diet-treatment groups: fat restricted (blue) and carbohydrate restricted (red).

References

    1. Alm JS, Swartz J, Lilja G, Scheynius A, Pershagen G. Atopy in children of families with an anthroposophic lifestyle. Lancet. 1999;353:1485–1488. - PubMed
    1. Blair JE, Hedges SB. Molecular phylogeny and divergence times of deuterostome animals. Mol Biol Evol. 2005;22:2275–2284. - PubMed
    1. Brodribb J, Condon RE, Cowles V, DeCosse JJ. Influence of dietary fiber on transit time, fecal composition, and myoelectrical activity of the primate right colon. Digest Dis Sci. 1980;25:260–266. - PubMed
    1. Claesson MJ, O'Sullivan O, Wang Q, Nikkilä J, Marchesi JR, Smidt H, et al. Comparative analysis of pyrosequencing and a phylogenetic microarray for exploring microbial community structures in the human distal intestine. PloS One. 2009;4:e6669. - PMC - PubMed
    1. Cole JR, Wang Q, Cardenas E, Fish J, Chai B, Farris RJ, et al. The Ribosomal Database Project: improved alignments and new tools for rRNA analysis. Nucleic Acids Res. 2009;37:D141–D145. - PMC - PubMed

Publication types

Substances