

Time Course Analysis of Gene Expression Patterns in Zebrafish Eye During Optic Nerve Regeneration
- PMID: 20740047
- PMCID: PMC2926816
Time Course Analysis of Gene Expression Patterns in Zebrafish Eye During Optic Nerve Regeneration
Abstract
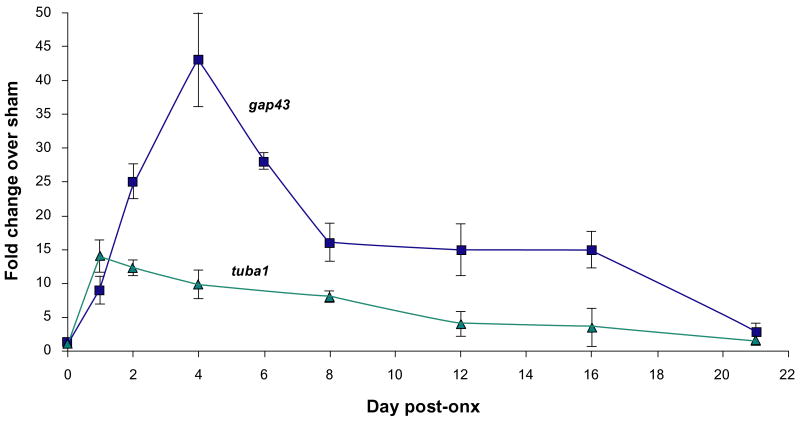
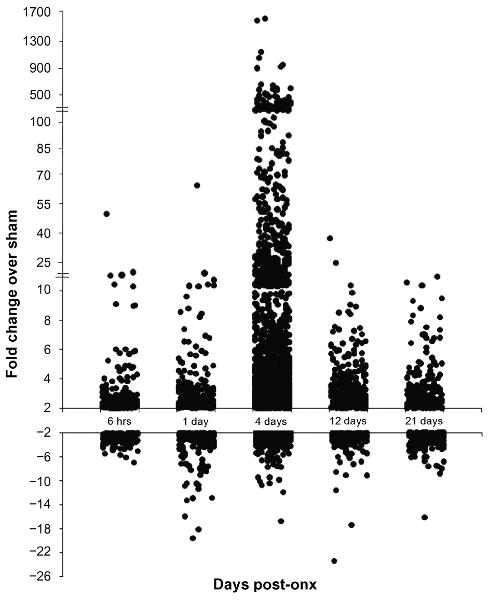
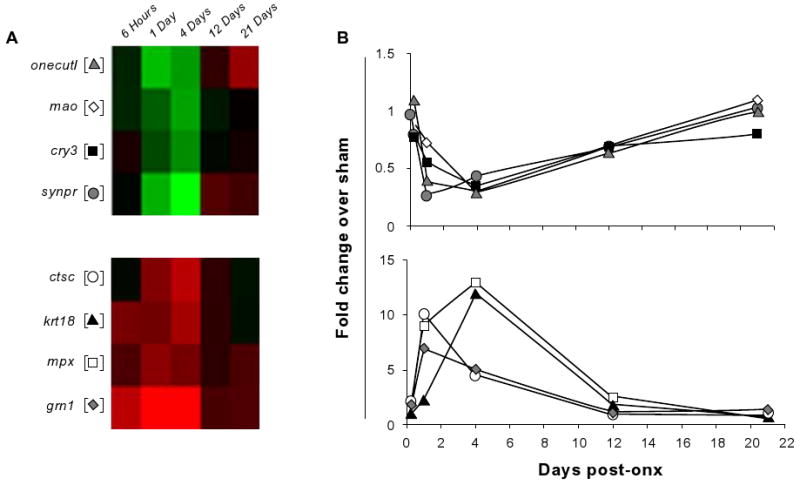
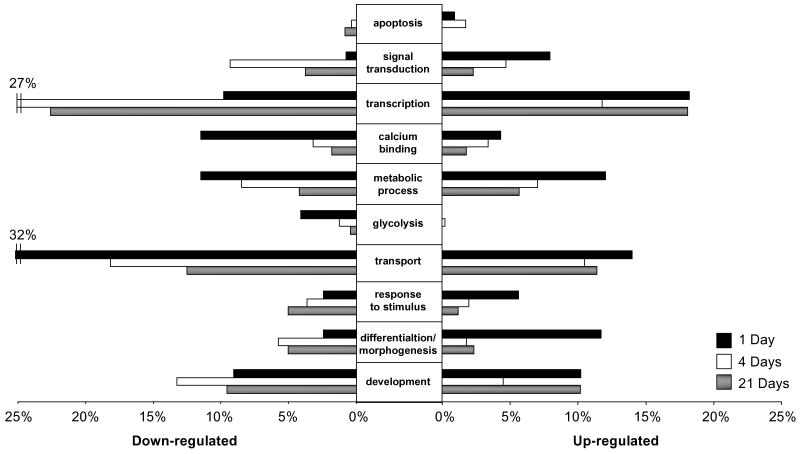
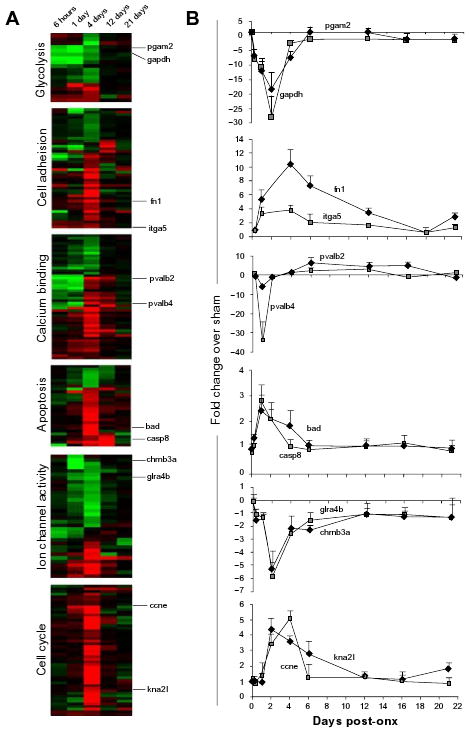
It is well-established that neurons in the adult mammalian central nervous system (CNS) are terminally differentiated and, if injured, will be unable to regenerate their connections. In contrast to mammals, zebrafish and other teleosts display a robust neuroregenerative response. Following optic nerve crush (ONX), retinal ganglion cells (RGC) regrow their axons to synapse with topographically correct targets in the optic tectum, such that vision is restored in approximately 21 days. What accounts for these differences between teleostean and mammalian responses to neural injury is not fully understood. A time course analysis of global gene expression patterns in the zebrafish eye after ONX can help to elucidate cellular and molecular mechanisms that contribute to a successful neuroregeneration. To define different phases of regeneration after ONX, alpha tubulin 1 (tuba1) and growth-associated protein 43 (gap43), markers previously shown to correspond to morphophological events, were measured by real time quantitative PCR (qPCR). Microarray analysis was then performed at defined intervals (6 hours, 1, 4, 12, and 21 days) post-ONX and compared to SHAM. Results show that optic nerve damage induces multiple, phase-related transcriptional programs, with the maximum number of genes changed and highest fold-change occurring at 4 days. Several functional groups affected by optic nerve regeneration, including cell adhesion, apoptosis, cell cycle, energy metabolism, ion channel activity, and calcium signaling, were identified. Utilizing the whole eye allowed us to identify signaling contributions from the vitreous, immune and glial cells as well as the neural cells of the retina. Comparisons between our dataset and transcriptional profiles from other models of regeneration in zebrafish retina, heart and fin revealed a subset of commonly regulated transcripts, indicating shared mechanisms in different regenerating tissues. Knowledge of gene expression patterns in all components of the eye in a model of successful regeneration provides an entry point for functional analyses, and will help in devising hypotheses for testing normal and toxic regulatory factors.
Figures
Similar articles
-
Intraocular Axon Regeneration in a Model of Penetrating Eye Injury.J Ocul Pharmacol Ther. 2023 Oct;39(8):563-571. doi: 10.1089/jop.2023.0048. Epub 2023 Jul 24. J Ocul Pharmacol Ther. 2023. PMID: 37486664 Free PMC article.
-
Optic nerve regeneration in larval zebrafish exhibits spontaneous capacity for retinotopic but not tectum specific axon targeting.PLoS One. 2019 Jun 20;14(6):e0218667. doi: 10.1371/journal.pone.0218667. eCollection 2019. PLoS One. 2019. PMID: 31220164 Free PMC article.
-
Comparative gene expression profiling between optic nerve and spinal cord injury in Xenopus laevis reveals a core set of genes inherent in successful regeneration of vertebrate central nervous system axons.BMC Genomics. 2020 Aug 5;21(1):540. doi: 10.1186/s12864-020-06954-8. BMC Genomics. 2020. PMID: 32758133 Free PMC article.
-
The basic science of optic nerve regeneration.Ann Transl Med. 2021 Aug;9(15):1276. doi: 10.21037/atm-20-5351. Ann Transl Med. 2021. PMID: 34532413 Free PMC article. Review.
-
Optic nerve regeneration in mammals: Regenerated or spared axons?Exp Neurol. 2017 Oct;296:83-88. doi: 10.1016/j.expneurol.2017.07.008. Epub 2017 Jul 14. Exp Neurol. 2017. PMID: 28716559 Free PMC article. Review.
Cited by
-
Integrated analyses of zebrafish miRNA and mRNA expression profiles identify miR-29b and miR-223 as potential regulators of optic nerve regeneration.BMC Genomics. 2015 Aug 12;16(1):591. doi: 10.1186/s12864-015-1772-1. BMC Genomics. 2015. PMID: 26265132 Free PMC article.
-
Regeneration associated transcriptional signature of retinal microglia and macrophages.Sci Rep. 2019 Mar 18;9(1):4768. doi: 10.1038/s41598-019-41298-8. Sci Rep. 2019. PMID: 30886241 Free PMC article.
-
Meta-analysis of transcriptomic changes in optic nerve injury and neurodegenerative models reveals a fundamental response to injury throughout the central nervous system.Mol Vis. 2017 Dec 24;23:987-1005. eCollection 2017. Mol Vis. 2017. PMID: 29386873 Free PMC article.
-
The asparaginyl endopeptidase legumain is essential for functional recovery after spinal cord injury in adult zebrafish.PLoS One. 2014 Apr 18;9(4):e95098. doi: 10.1371/journal.pone.0095098. eCollection 2014. PLoS One. 2014. PMID: 24747977 Free PMC article.
-
Comparison of proteomic profiles in the zebrafish retina during experimental degeneration and regeneration.Sci Rep. 2017 Mar 16;7:44601. doi: 10.1038/srep44601. Sci Rep. 2017. PMID: 28300160 Free PMC article.
References
-
- Lie DC, Song H, Colamarino SA, Ming GL, Gage FH. Neurogenesis in the adult brain: new strategies for central nervous system diseases. Annu Rev Pharmacol Toxicol. 2004;44:399–421. - PubMed
-
- Cajal RY. Degeneration and Regeneration of the Nervous System. New York: Oxford University Press; 1991.
-
- Dezawa M, Adachi-Usami E. Role of Schwann cells in retinal ganglion cell axon regeneration. Prog Retin Eye Res. 2000;19(2):171–204. - PubMed
-
- Hirsch S, Bahr M. Growth promoting and inhibitory effects of glial cells in the mammalian nervous system. Adv Exp Med Biol. 1999;468:199–205. - PubMed
Grants and funding
LinkOut - more resources
Full Text Sources
Molecular Biology Databases
Miscellaneous