. 2010 Aug 5:4:33.
doi: 10.3389/fnbeh.2010.00033. eCollection 2010.

Probing the natural scene by echolocation in bats

Affiliations

Probing the natural scene by echolocation in bats

Cynthia F Moss et al. Front Behav Neurosci. .

Abstract

Bats echolocating in the natural environment face the formidable task of sorting signals from multiple auditory objects, echoes from obstacles, prey, and the calls of conspecifics. Successful orientation in a complex environment depends on auditory information processing, along with adaptive vocal-motor behaviors and flight path control, which draw upon 3-D spatial perception, attention, and memory. This article reviews field and laboratory studies that document adaptive sonar behaviors of echolocating bats, and point to the fundamental signal parameters they use to track and sort auditory objects in a dynamic environment. We suggest that adaptive sonar behavior provides a window to bats' perception of complex auditory scenes.

Keywords: action-perception; auditory scene analysis; hearing; neuroethology; stream segregation.


Figures
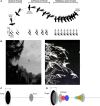
Figure 1
Figure 1
When an insectivorous bat pursues an insect it changes the calls in a typical sequence of search, approach and terminal buzz phase calls, where duration gradually decreases, while band width and repetition rate increase. A shows a series of cartoon images, depicting a bat pursuing an insect. The sonar beam pattern is aimed in different directions during the search phase. Towards the end of the approach phase and through the terminal buzz, the sonar beam is directed at the prey. B shows spectrograms of typical FM echolocation signals produced by the big brown bat, Eptesicus fuscus, at each of the phases of insect pursuit. The lower panels illustrate that a bat hunting insects out in the open sky, where all other objects are far away, will often encounter fairly “clean” echo returns from isolated objects, whereas a bat hunting close to vegetation will encounter a far more complex auditory scene composed of echoes from many objects arriving at different delays and intervals.
Figure 2
Figure 2
Schematically illustrates a bat in an environment that contains a single prey item and trees at different distances. Below, each horizontal line in the plot corresponds to a sonar vocalization, starting from 1500 ms before capture until time zero (top to bottom on the left y-axis), when the bat intercepts the prey. The separation between the lines corresponds to sonar call intervals decreasing with decreasing distance to the prey. The resulting streams of echoes at changing delays are shown as open boxes with widths corresponding to call duration and color coding of the insect (black) and trees (red, blue, and green) in the panel above. The signal durations and intervals are based on a pursuit sequence recorded from Eptesicus fuscus in the wild. The acoustic phases of insect pursuit from search to terminal buzz phase are indicated on the right y-axis. As the bat flies closer to the trees and insect, the echo delays shorten. Each of the reflecting objects appears as a distinct ridge with a particular slope, corresponding to the rate of delay change of echoes over time. In this display, one can visually identify and track the returning echoes from the trees and insect over time.
Figure 3
Figure 3
Contains schematics illustrating the experimental setup and recording methods in the obstacle avoidance/insect capture task (top). (A) The bat was trained to fly through one of two openings in a net that was stretched across the room (see top left diagram). Behind one of the openings, a food reward (tethered mealworm) was presented. Two high-speed IR sensitive video cameras recorded the positions of the obstacles, prey and the bat's flight behavior, which were later used for off-line analyses. Microphones on the floor recorded the full bandwidth of the bat's sonar signals. A microphone array, positioned along three walls, was used to reconstruct the bat's sonar beam pattern. (B), above, show the bat's 3D flight path through the net and to intercept the tethered insect, and, below, the corresponding changes in the duration and interval between successive sonar calls. Zero on the x-axes of these plots marks the time when the bat passes through the net opening. More details on the sonar beam reconstruction are presented in the top right panel (C), which shows an overhead view of the flight room and microphone array. The beam pattern is reconstructed from the relative energy of signals recorded at each of the microphones along the three walls. (D) Schematic illustrates how changes in the bat's call duration determine whether its signals overlap with echoes from objects in the environment. (E) Plots show data collected from a trial in which the bat approaches the net opening on the left. The left plot shows the beam pattern for selected vocalizations as the bat approaches the net. The right plot displays the beam axis for each vocalization, and they are color coded according to the directional aim of the sonar beam as the bat begins its approach to the net, blue for the right edge of the net opening, green for the left edge of the net opening and red for the tethered worm. Note the bat's sequential scanning of the closely spaced objects in this trial. Adapted from Surlykke et al. (2009a).
Figure 4
Figure 4
Shows the ranging accuracy for approach signals and search type signals in big brown bats, Eptesicus fuscus. Two bats were trained in a psychophysical experiment, using a Yes/No procedure in a phantom target simulator. When the echo was a short broadband approach signal the bats could determine echo delay with around 85 μs accuracy, corresponding to a range difference of 1.5 cm, whereas long narrow band search type signals as echoes resulted in a ranging accuracy 10 times as long, more than 800 μs or 15 cm.
Figure 5
Figure 5
Call adjustments for frequency streaming in Eptesicus fuscus. Upper left photo illustrating bats vocalizing in close proximity. Photo taken by Jessica Nelson, and image assembled by Chen Chiu. Upper right plots adjustment in call frequency as a function of baseline call separation across bat pairs. Bats with similar baseline calls made larger adjustments in the end frequency the FM sweep of their calls than those with different baseline calls. Bottom panel shows raw sonar signal recording segment from two bats flying together in close proximity. Call assignment to the vocalizing bat could be made by combining three microphone recordings and 3D video position data. Adapted from Chiu et al. (2009).
Figure 6
Figure 6
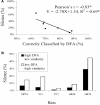
Silent behavior for jamming avoidance in Eptesicus fuscus. (A) shows the prevalence of silent behavior (no calls over a minimum of 200 ms) as a function of baseline call similarity in bat pairs. For bat pairs that showed greater call similarity in baseline trials when they flew alone calls (% DFA classification lower), there was more silent behavior than for bat pairs that showed baseline call dissimilarity calls (% DFA classification higher). (B) shows % silent behavior for five individual bats, each paired with two different bats. When paired with a bat whose baseline call similarity was comparatively high (low DFA, white bars), bats consistently exhibited more silent behavior than when paired with a bat whose baseline call similarity was comparatively low (high DFA, black bars). Adapted from Chiu et al. (2008).
Figure 7
Figure 7
Temporal adjustments of sonar calls in bats foraging in the lab (left, Eptesicus fuscus) and in the field (right, Macrophyllum macrophyllum). Both examples illustrate “sonar strobing” behavior, i.e. the production of sound groups with relatively stable intervals, as they approach prey. The far left panels are taken from typical laboratory trials and show 3D flight paths of bats as they take tethered insects in the vicinity of vegetation. The adjacent panels show overhead views of the same trials. Arrows indicate the direction of the flight path. The numbers in the upper left corner of each plot indicate the distance between the tethered insect and the vegetation, shown in green. Flight segments that contained “sonar strobe groups” are displayed in red. The pulse intervals for each of these four trials are plotted, and calls that fit the criterion for “sonar strobe groups” (<5% variation in PI) are circled in red. Adapted from Moss et al. (2006). Right, sonar strobing behavior taken from field recordings of M. macrophyllum. SC search calls, AC approach calls, TG terminal group, CM capture of mealworm. Adapted from Weinbeer and Kalko (2007).
Figure 8
Figure 8
Schematic illustrating the active adjustments that bats make in call frequency (A), beam aim (B) and signal duration (C) that can aide in the segregation and streaming of acoustic information along the perceptual dimensions of pitch, direction, and distance.

Similar articles

Cited by

References

    1. Au W. W. L. (1993). The Sonar of Dolphins. New York: Springer
    1. Aytekin M., Grassi E., Sahota M., Moss C. F. (2004). The bat head-related transfer function reveals binaural cues for sound. - PubMed
    1. Barak Y., Yom-Tov Y. (1989). The advantage of group hunting to Kuhl's pipistrelle bat Pipistrellus kuhli (Microchiroptera). J. Zool. 219, 670–67510.1111/j.1469-7998.1989.tb02608.x - DOI
    1. Bates M. E., Stamper S. A., Simmons J. A. (2008). Jamming avoidance response of big brown bats in target detection. J. Exp. Biol. 211, 106–11310.1242/jeb.009688 - DOI - PubMed
    1. Batteau D. W. (1967). The role of the pinna in human localization. Proc. R. Soc. Lond. 1011, 158–18010.1098/rspb.1967.0058 - DOI - PubMed

LinkOut - more resources