

Spatial probability AIDS visual stimulus discrimination
- PMID: 20740078
- PMCID: PMC2927278
- DOI: 10.3389/fnhum.2010.00063
Spatial probability AIDS visual stimulus discrimination
Abstract
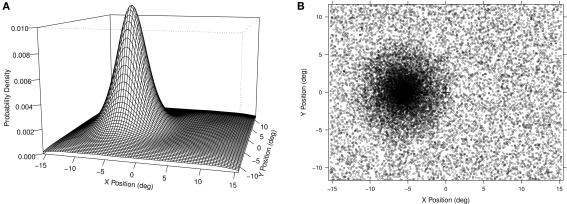
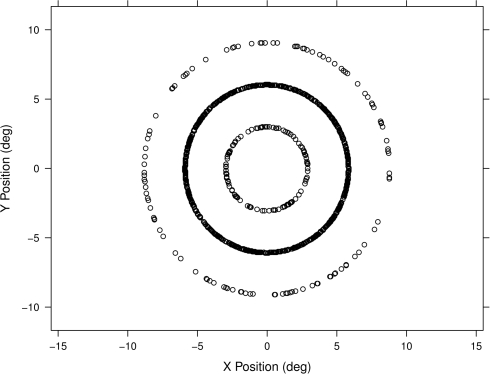
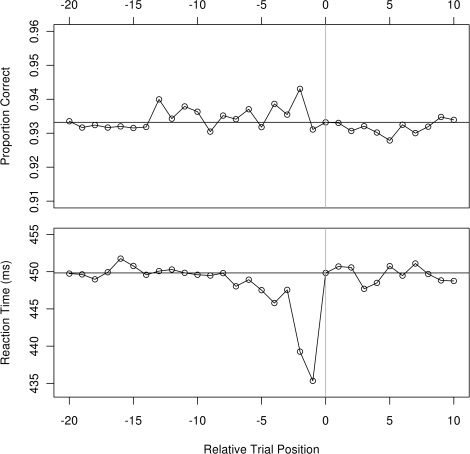
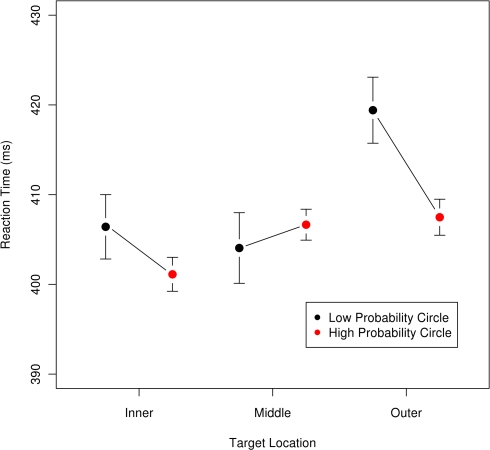
We investigated whether the statistical predictability of a target's location would influence how quickly and accurately it was classified. Recent results have suggested that spatial probability can be a cue for the allocation of attention in visual search. One explanation for probability cuing is spatial repetition priming. In our two experiments we used probability distributions that were continuous across the display rather than relying on a few arbitrary screen locations. This produced fewer spatial repeats and allowed us to dissociate the effect of a high-probability location from that of short-term spatial repetition. The task required participants to quickly judge the color of a single dot presented on a computer screen. In Experiment 1, targets were more probable in an off-center hotspot of high-probability that gradually declined to a background rate. Targets garnered faster responses if they were near earlier target locations (priming) and if they were near the high-probability hotspot (probability cuing). In Experiment 2, target locations were chosen on three concentric circles around fixation. One circle contained 80% of targets. The value of this ring distribution is that it allowed for a spatially restricted high-probability zone in which sequentially repeated trials were not likely to be physically close. Participant performance was sensitive to the high-probability circle in addition to the expected effects of eccentricity and the distance to recent targets. These two experiments suggest that inhomogeneities in spatial probability can be learned and used by participants on-line and without prompting as an aid for visual stimulus discrimination and that spatial repetition priming is not a sufficient explanation for this effect. Future models of attention should consider explicitly incorporating the probabilities of targets locations and features.
Keywords: attention; perception; reaction time; vision.
Figures
Similar articles
-
Spatial probability as an attentional cue in visual search.Percept Psychophys. 2005 Oct;67(7):1252-68. doi: 10.3758/bf03193557. Percept Psychophys. 2005. PMID: 16502846
-
"Guidance of spatial attention by incidental learning and endogenous cuing": Retraction.J Exp Psychol Hum Percept Perform. 2022 Jul;48(7):782. doi: 10.1037/xhp0001027. Epub 2022 Jun 9. J Exp Psychol Hum Percept Perform. 2022. PMID: 35679190 Free PMC article.
-
Guidance of spatial attention by incidental learning and endogenous cuing.J Exp Psychol Hum Percept Perform. 2013 Feb;39(1):285-97. doi: 10.1037/a0028022. Epub 2012 Apr 16. J Exp Psychol Hum Percept Perform. 2013. Retraction in: J Exp Psychol Hum Percept Perform. 2022 Jul;48(7):782. doi: 10.1037/xhp0001027. PMID: 22506784 Free PMC article. Retracted.
-
Spatial probability cuing and right hemisphere damage.Brain Cogn. 2012 Dec;80(3):352-60. doi: 10.1016/j.bandc.2012.08.006. Epub 2012 Oct 17. Brain Cogn. 2012. PMID: 23085204
-
Modulation of spatial attention by goals, statistical learning, and monetary reward.Atten Percept Psychophys. 2015 Oct;77(7):2189-206. doi: 10.3758/s13414-015-0952-z. Atten Percept Psychophys. 2015. PMID: 26105657 Free PMC article.
Cited by
-
The development of organized visual search.Acta Psychol (Amst). 2013 Jun;143(2):191-9. doi: 10.1016/j.actpsy.2013.03.008. Epub 2013 Apr 11. Acta Psychol (Amst). 2013. PMID: 23584560 Free PMC article.
-
Spatial reference frame of attention in a large outdoor environment.J Exp Psychol Hum Percept Perform. 2014 Aug;40(4):1346-57. doi: 10.1037/a0036779. Epub 2014 May 19. J Exp Psychol Hum Percept Perform. 2014. PMID: 24842066 Free PMC article.
-
Conditional probability modulates visual search efficiency.Front Hum Neurosci. 2013 Oct 17;7:683. doi: 10.3389/fnhum.2013.00683. eCollection 2013. Front Hum Neurosci. 2013. PMID: 24146645 Free PMC article.
-
Endogenous and exogenous control of visuospatial selective attention in freely behaving mice.Nat Commun. 2020 Apr 24;11(1):1986. doi: 10.1038/s41467-020-15909-2. Nat Commun. 2020. PMID: 32332741 Free PMC article.
-
Strategies of the honeybee Apis mellifera during visual search for vertical targets presented at various heights: a role for spatial attention?F1000Res. 2014 Jul 28;3:174. doi: 10.12688/f1000research.4799.1. eCollection 2014. F1000Res. 2014. PMID: 25254109 Free PMC article.
References
-
- Baayen R. (2008). Analyzing Linguistic Data: A Practical Introduction to Statistics Using R. Cambridge, UK: Cambridge University Press
-
- Bates D. (2005). Fitting linear mixed models in R. R News 5, 27–30
-
- Carrasco M., Evert D., Chang I., Katz B. (1995). The eccentricity effect: target eccentricity affects performance on conjunction searches. Percept. Psychophys. 57, 1241–1261 - PubMed
-
- Cave K. R., Bichot N. P. (1999). Visuospatial attention: beyond a spotlight model. Psychon. Bull. Rev. 6, 204–223 - PubMed
LinkOut - more resources
Full Text Sources
Other Literature Sources