Corticomuscular coherence between motor cortex, somatosensory areas and forearm muscles in the monkey
- PMID: 20740079
- PMCID: PMC2927302
- DOI: 10.3389/fnsys.2010.00038
Corticomuscular coherence between motor cortex, somatosensory areas and forearm muscles in the monkey
Abstract
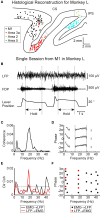
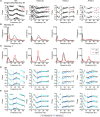
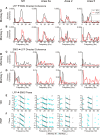
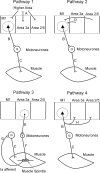
Corticomuscular coherence has previously been reported between primary motor cortex (M1) and contralateral muscles. We examined whether such coherence could also be seen from somatosensory areas. Local field potentials (LFPs) were recorded from primary somatosensory cortex (S1; areas 3a and 2) and posterior parietal cortex (PPC; area 5) simultaneously with M1 LFP and forearm EMG activity in two monkeys during an index finger flexion task. Significant beta-band ( approximately 20 Hz) corticomuscular coherence was found in all areas investigated. Directed coherence (Granger causality) analysis was used to investigate the direction of effects. Surprisingly, the strongest beta-band directed coherence was in the direction from S1/PPC to muscle; it was much weaker in the ascending direction. Examination of the phase of directed coherence provided estimates of the time delay from cortex to muscle. Delays were longer from M1 ( approximately 62 ms for the first dorsal interosseous muscle) than from S1/PPC ( approximately 36 ms). We then looked at coherence and directed coherence between M1 and S1 for clues to this discrepancy. Directed coherence showed large beta-band effects from S1/PPC to M1, with smaller directed coherence in the reverse direction. The directed coherence phase suggested a delay of approximately 40 ms from M1 to S1. Corticomuscular coherence from S1/PPC could involve multiple pathways; the most important is probably common input from M1 to S1/PPC and muscles. If correct, this implies that somatosensory cortex receives oscillatory efference copy information from M1 about the motor command. This could allow sensory inflow to be interpreted in the light of its motor context.
Keywords: oscillations; sensorimotor.
Figures


Similar articles
-
The cerebral oscillatory network of parkinsonian resting tremor.Brain. 2003 Jan;126(Pt 1):199-212. doi: 10.1093/brain/awg022. Brain. 2003. PMID: 12477707
-
Effects of muscle contraction on somatosensory event-related EEG power and coherence changes.Neurophysiol Clin. 2004 Dec;34(5):245-56. doi: 10.1016/j.neucli.2004.09.002. Epub 2004 Nov 4. Neurophysiol Clin. 2004. PMID: 15639132 Clinical Trial.
-
Contributions of descending and ascending pathways to corticomuscular coherence in humans.J Physiol. 2011 Aug 1;589(Pt 15):3789-800. doi: 10.1113/jphysiol.2011.211045. Epub 2011 May 30. J Physiol. 2011. PMID: 21624970 Free PMC article.
-
Gating of tactile information through gamma band during passive arm movement in awake primates.Front Neural Circuits. 2015 Oct 26;9:64. doi: 10.3389/fncir.2015.00064. eCollection 2015. Front Neural Circuits. 2015. PMID: 26578892 Free PMC article.
-
The neuromechanical of Beta-band corticomuscular coupling within the human motor system.Front Neurosci. 2024 Aug 15;18:1441002. doi: 10.3389/fnins.2024.1441002. eCollection 2024. Front Neurosci. 2024. PMID: 39211436 Free PMC article. Review.
Cited by
-
Transient beta activity and cortico-muscular connectivity during sustained motor behaviour.Prog Neurobiol. 2022 Jul;214:102281. doi: 10.1016/j.pneurobio.2022.102281. Epub 2022 May 10. Prog Neurobiol. 2022. PMID: 35550908 Free PMC article.
-
Abnormal patterns of corticomuscular and intermuscular coherence in childhood dystonia.Clin Neurophysiol. 2020 Apr;131(4):967-977. doi: 10.1016/j.clinph.2020.01.012. Epub 2020 Feb 4. Clin Neurophysiol. 2020. PMID: 32067914 Free PMC article.
-
Cross-frequency cortex-muscle interactions are abnormal in young people with dystonia.Brain Commun. 2024 Feb 26;6(2):fcae061. doi: 10.1093/braincomms/fcae061. eCollection 2024. Brain Commun. 2024. PMID: 38487552 Free PMC article.
-
Increased Corticomuscular Coherence in Idiopathic REM Sleep Behavior Disorder.Front Neurol. 2012 Apr 23;3:60. doi: 10.3389/fneur.2012.00060. eCollection 2012. Front Neurol. 2012. PMID: 22536195 Free PMC article.
-
Reorganization of functional and directed corticomuscular connectivity during precision grip from childhood to adulthood.Sci Rep. 2021 Nov 24;11(1):22870. doi: 10.1038/s41598-021-01903-1. Sci Rep. 2021. PMID: 34819532 Free PMC article.
References
-
- Amjad A. M., Halliday D. M., Rosenberg J. R., Conway B. A. (1997). An extended difference of coherence test for comparing and combining several independent coherence estimates: theory and application to the study of motor units and physiological tremor. J. Neurosci. Methods 73, 69–7910.1016/S0165-0270(96)02214-5 - DOI - PubMed
Grants and funding
LinkOut - more resources
Full Text Sources

