. 2010 Aug 10:4:65.
doi: 10.3389/fnhum.2010.00065. eCollection 2010.

Mal-adaptation of event-related EEG responses preceding performance errors

Affiliations

Mal-adaptation of event-related EEG responses preceding performance errors

Heike Eichele et al. Front Hum Neurosci. .

Abstract

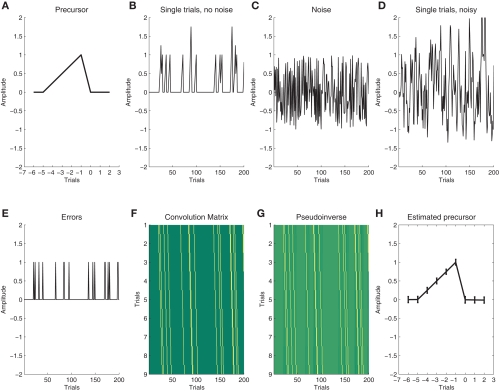
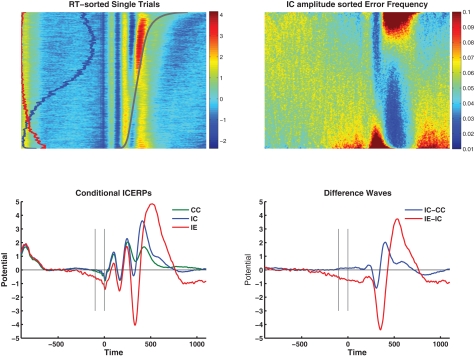
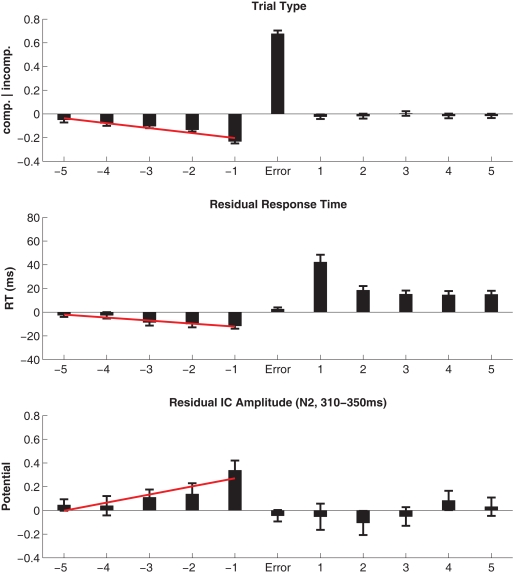
Recent EEG and fMRI evidence suggests that behavioral errors are foreshadowed by systematic changes in brain activity preceding the outcome by seconds. In order to further characterize this type of error precursor activity, we investigated single-trial event-related EEG activity from 70 participants performing a modified Eriksen flanker task, in particular focusing on the trial-by-trial dynamics of a fronto-central independent component that previously has been associated with error and feedback processing. The stimulus-locked peaks in the N2 and P3 latency range in the event-related averages showed expected compatibility and error-related modulations. In addition, a small pre-stimulus negative slow wave was present at erroneous trials. Significant error-preceding activity was found in local stimulus sequences with decreased conflict in the form of less negativity at the N2 latency (310-350 ms) accumulating across five trials before errors; concomitantly response times were speeding across trials. These results illustrate that error-preceding activity in event-related EEG is associated with the performance monitoring system and we conclude that the dynamics of performance monitoring contribute to the generation of error-prone states in addition to the more remote and indirect effects in ongoing activity such as posterior alpha power in EEG and default mode drifts in fMRI.

Keywords: deconvolution; errors; event-related EEG; independent component analysis; performance monitoring; single trial analysis.


Figures

Figure 1
Figure 1
Illustration of deconvolution of latent sequential effects. (A) We assume a latent precursor signal that gradually evolves across trials and precedes each error; (B) In order to illustrate a noiseless sequence of single trials we convolve a vector with 10% errors at random instances, note the summation of overlapping sequences; (C) for real data, we assume additional noise; (D) Convolution of the noisy data (C+E) with (A) yields the simulated single-trial data that are used for deconvolution; (E) In order to deconvolve the data, we use a “Stick”-function that describes the occurrence of errors; (F) stacking the stick function at different lags is the convolution matrix; (G) we then take the pseudo-inverse of (F) and multiply the resulting matrix with the noisy data (D); (H) The product is an estimate of the precursor. In this figure, we show the average across 100 runs, error bars indicate the ±1 standard deviation around the mean.
Figure 2
Figure 2
Top row, left: the group average topography, scaled from −2 to +2 μV shows a clear maximum at FCz, extending to the neighboring electrodes FC, FC2, C1, Cz and C2. The spatial T-map (top row, middle) and the corresponding map of the standard error of the mean (SEM) illustrate the robustness of the selected topography in the sample. The middle and bottom rows (participants A–F) provide six randomly drawn single subject replications.
Figure 3
Figure 3
Top left: Group average RT-sorted single-trial ICERP image showing the dependency of the stimulus-locked response on RT (gray line). The relative frequency of incompatible trials is given on the left of the image in blue, the proportion of errors in red. The figure illustrates in particular N2 and P3 preceding the response in mainly correct trials with slower RT (top half of the image), and ERN and PE following the response at error trials (bottom quarter of the image). Top right: Shows the average accuracy across the group sorted by the component amplitude at each time point and shows higher error rates in red, and lower than error rates in blue (equivalent to “vincentizing”). The dominant feature in the figure is the scaling of error rate with increasing negative amplitudes during the N2/ERN latency and during the pre-stimulus negativity, and inversely during the P3/Pe latency range. Bottom left: conditional ICERPs for compatible correct (CC, green), incompatible correct (IC, blue), and error responses (IE, red). Bottom right: difference waves for incompatible correct minus compatible correct (blue) and incompatible errors minus incompatible correct (red).
Figure 4
Figure 4
Top panel: Most errors occurred to incompatible trials, and error-preceding trials showed an increased frequency of compatible trials. Following errors, the probability of compatible/incompatible outcomes is equal (as it is across the entire experiment). Middle panel: Residual RTs were on average 11 ms faster in trials immediately prior to errors and were speeding by 2.5 ms per trial from −5 to −1. Post-error slowing of responses by 42 ms was observed and in subsequent trials sustained slowing on the order of 15 ms was present. Bottom panel: The residual amplitude at the N2 latency was less negative in trials prior to errors and a trend was present across the five error-preceding trials. Following errors, N2 estimates returned to baseline. Note that, in contradistinction to Figure 3, conflict-related N2 modulations as well as the error-related amplitude increase equivalent to the ERN/N2 have been removed by multiple linear regression.

Similar articles

Cited by

References

    1. Allain S., Carbonnell L., Falkenstein M., Burle B., Vidal F. (2004). The modulation of the Ne-like wave on correct responses foreshadows errors. Neurosci. Lett. 372, 161–16610.1016/j.neulet.2004.09.036 - DOI - PubMed
    1. Arieli A., Sterkin A., Grinvald A., Aertsen A. (1996). Dynamics of ongoing activity: explanation of the large variability in evoked cortical responses. Science 273, 1868–187110.1126/science.273.5283.1868 - DOI - PubMed
    1. Bell A. J., Sejnowski T. J. (1995). An information-maximization approach to blind separation and blind deconvolution. Neural. Comput. 7, 1129–115910.1162/neco.1995.7.6.1129 - DOI - PubMed
    1. Bestmann S., Harrison L. M., Blankenburg F., Mars R. B., Haggard P., Friston K. J., Rothwell J. C. (2008). Influence of uncertainty and surprise on human corticospinal excitability during preparation for action. Curr. Biol. 18, 775–78010.1016/j.cub.2008.04.051 - DOI - PMC - PubMed
    1. Botvinick M. M. (2007). Conflict monitoring and decision making: reconciling two perspectives on anterior cingulate function. Cogn. Affect. Behav. Neurosci. 7, 356–36610.3758/CABN.7.4.356 - DOI - PubMed