. 2011 Feb;95(2):77-93.
doi: 10.1002/bip.21537. Epub 2010 Aug 24.

Collagen oligomers modulate physical and biological properties of three-dimensional self-assembled matrices

Affiliations

Collagen oligomers modulate physical and biological properties of three-dimensional self-assembled matrices

J L Bailey et al. Biopolymers. 2011 Feb.

Abstract

Elucidation of mechanisms underlying collagen fibril assembly and matrix-induced guidance of cell fate will contribute to the design and expanded use of this biopolymer for research and clinical applications. Here, we define how Type I collagen oligomers affect in-vitro polymerization kinetics as well as fibril microstructure and mechanical properties of formed matrices. Monomers and oligomers were fractionated from acid-solubilized pig skin collagen and used to generate formulations varying in monomer/oligomer content or average polymer molecular weight (AMW). Polymerization half-times decreased with increasing collagen AMW and closely paralleled lag times, indicating that oligomers effectively served as nucleation sites. Furthermore, increasing AMW yielded matrices with increased interfibril branching and had no correlative effect on fibril density or diameter. These microstructure changes increased the stiffness of matrices as evidenced by increases in both shear storage and compressive moduli. Finally, the biological relevance of modulating collagen AMW was evidenced by the ability of cultured endothelial colony forming cells to sense associated changes in matrix physical properties and alter vacuole and capillary-like network formation. This work documents the importance of oligomers as another physiologically-relevant design parameter for development and standardization of polymerizable collagen formulations to be used for cell culture, regenerative medicine, and engineered tissue applications.


Figures

FIGURE 1
FIGURE 1
PSC starting material (Lanes 1 and 4) as well as glycerol-derived oligomer- (Lanes 2 and 5) and monomer-rich (Lanes 3 and 6) fractions represent different molecular compositions of Type I collagen as demonstrated by SDS-PAGE (4%, Lanes 1–3) and Western blot (collagen α1(I) antibody, Lanes 4–5). In addition to α1(I), α2(I), β11(I), β12(I), and γ (I) bands routinely observed in denatured collagen preparations, PSC contained prominent bands corresponding to molecular weights of 260 kDa (Oligo 260) and greater than 300 kDa (HMW). Oligo260 and HMW components (arrows) were retained at significant levels in the oligomer-rich fraction and found at substantially reduced levels in the monomer-rich fraction. Western analysis with an antibody specific for collagen α1(I) verified that Oligo260 and HMW bands contained the type I collagen epitope. Molecular weight markers are indicated in left margin.
FIGURE 2
FIGURE 2
Representative turbidity plots (A) showing time-dependent changes in A405 during polymerization of monomer- (gray triangles) and oligomer-rich (black squares) fractions (0.7 mg ml−1 collagen concentration) derived from the glycerol-based protocol. Data was collected at 10-s intervals. To determine how polymerization kinetics varied with collagen concentration, formulations were polymerized using identical reaction conditions and collagen concentrations of 0.5, 0.7, and 1 mg ml−1. Kinetic parameters, including half-time (B), lag time (C), and growth rate (D) were calculated from the resultant turbidity curves. Both single (squares) and batched (circles) PSC sources were used to generate monomer- (open shapes) and oligomer-rich (solid shapes) fractions. Data points represent mean ± SD (n ≥ 4) with associated best-fit lines calculated for single and batched PSC sources collectively. In some cases, error bars are smaller than the data symbols. Best-fit lines obtained for monomer-(dashed lines) and oligomer-rich (solid lines) fractions were statistically different (P < 0.05) for all measured kinetic parameters. Oligomer-rich displayed the shortest polymerization half-time, shortest lag times, and fastest growth rates for each concentration tested (P < 0.05).
FIGURE 3
FIGURE 3
Shear storage modulus (G′,A), phase shift (δ,B), and compressive modulus (Ec,C) for monomer- (open shapes, dashed lines) and oligomer-rich (solid shapes and lines) fractions prepared from single (squares) and batched (circles) PSC sources. Data points represent mean ± SD (n ≥ 4) with associated best-fit lines. Monomer- and oligomer-rich fractions demonstrated statistically different (P < 0.05) best-fit lines for each of the measured mechanical parameters G′, δ, and Ec as a function of concentration.
FIGURE 4
FIGURE 4
Polymerization kinetic parameters, including polymerization half-time (A), lag time (B), and growth rate (C), as measured via a turbidimetric assay for collagen formulations with AMW ranging from 282 to 603 kDa. Glycerol-derived monomer- and oligomer-rich fractions were generated from both single (squares) and batched (circles) PSC sources. These fractions were combined in different proportions to generate different AMW. Polymerization was conducted using identical reaction conditions and a collagen concentration of 0.7 mg ml−1. Data points represent mean ± SD (n ≥ 4). Polymerization half-time and lag time decreased significantly (P < 0.05) as AMW was increased from 282 to 306 kDa and then remained relatively constant for AMW up to 603 kDa. In contrast, growth rate increased monotonically with increasing AMW.
FIGURE 5
FIGURE 5
Collagen fibril microstructure of matrices prepared with collagens with AMW ranging from 282 to 603 kDa. Representative CRM images are shown for matrices polymerized at the same collagen concentration (0.7 mg ml−1) and under the same conditions. The 2D projections represent a total image thickness of 10 μm (101 slices, scale bar = 10 μm). Low AMW collagens produced entanglements of lengthy fibrils and the distance between interfibril branch points appeared to decrease with increasing AMW. Quantified microstructure parameters and associated statistical analyses are summarized in Table I.
FIGURE 6
FIGURE 6
Hierarchical matrix assembly for oligomer-rich collagen. Fibrils and their associated intermediates were negatively stained and observed by TEM early during the assembly process (A, scalebar = 500 nm). Longitudinal growth of larger fibrils was apparent as the branched network of microfibrils which were 5–25 nm in diameter coalesced at the tapered ends (A, black arrows). Lateral associations between growing fibril segments contributed to fibrils which were larger in diameter (up to 250 nm) and possessed identifiable branch points (A, white arrows). Branched fibrils were identified by the intermingling or entanglement of the molecular structure of adjacent fibrils, which was readily visible at higher magnifications. Fibril branching event identified by the white box in upper image is shown at higher magnification (B, scalebar = 3 μm).
FIGURE 7
FIGURE 7
Shear storage modulus (G′,A), phase shift (δ,B), and compressive modulus (Ec,C) for matrices prepared with collagen AMW ranging from 282 to 603 kDa. Both single (squares) and batched (circles) source formulations were polymerized using identical reaction conditions and a collagen concentration of 0.7 mg ml−1. Data points represent mean ± SD (n ≥ 4). G′ and Ec increased linearly while δ decreased with increasing AMW.
FIGURE 8
FIGURE 8
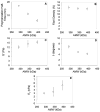
Similar trends in polymerization half-time (A), fibril density (B), and viscoelastic properties (C–E) as a function of AMW were observed with monomer- and oligomer-rich fraction generated by differential salt precipitation of PSC. Data points represent mean ± SD (n = 3).
FIGURE 9
FIGURE 9
Tuning AMW or monomer/oligomer content of 3D collagen matrices directed different cellular and vessel morphogenesis responses by cultured ECFCs. ECFCs (5 × 10⁵ cells ml−1) were cultured for 7 days within matrices prepared with monomer- (A and C) or oligomer-rich (B and D) collagen formulations. Matrices were matched in terms of collagen concentration (1 mg ml−1, A and B) or G′ (200 Pa, C and D). Constructs were stained with FITC-conjugated UEA1 lectin (green) and DRAQ5 nuclear stain (red) and imaged in combined fluorescence and reflection modes. Panels A–D represent z-stack projections (21 slices at 5 μm thickness each) showing combined lectin and nuclear staining. Insert in lower left corner of Panel D represents a cropped single slice image showing both lectin and collagen fibril microstructure to document that multi-cellular, capillary-like networks possessed lumens. Scale bar = 100 μm.
FIGURE 10
FIGURE 10
Modulation of matrix stiffness (G′) and collagen concentration of 3D matrices prepared from monomer- and oligomer-rich collagens induced formation of different vacuole densities (D), vacuole areas (E), and total vacuole areas (F) by entrapped ECFCs. ECFCs (5 × 10⁵ cells ml−1) were cultured for 2 days within monomer and oligomer matrices that were matched in collagen concentration (1 or 2.75 mg ml−1) or matrix stiffness (136 Pa). Panels A through C provide representative images of ECFC-derived vacuolated structures observed within toluidine blue stained tissue constructs. Inserts in bottom right corner depict the cell membrane (black) and vacuoles (white areas surrounded by black cell borders). Scale bar = 50 μm.

References

    1. Friess W. Eur J Pharm Biopharm. 1998;45:113–136. - PubMed
    1. Kyle S, Aggeli A, Ingham E, McPherson MJ. Trends Biotechnol. 2009;27:423–433. - PMC - PubMed
    1. Brodsky B, Persikov AV. Adv Protein Chem. 2005;70:301–339. - PubMed
    1. Persikov AV, Ramshaw JA, Brodsky B. J Biol Chem. 2005;280:19343–19349. - PubMed
    1. Burjanadze TV. Biopolymers. 1979;18:931–938. - PubMed

LinkOut - more resources