. 2011 Jan;65(1):60-70.
doi: 10.1002/mrm.22605.

Accelerated cardiac magnetic resonance imaging in the mouse using an eight-channel array at 9.4 Tesla

Affiliations
Free PMC article

Accelerated cardiac magnetic resonance imaging in the mouse using an eight-channel array at 9.4 Tesla

Jürgen E Schneider et al. Magn Reson Med. 2011 Jan.
Free PMC article

Abstract

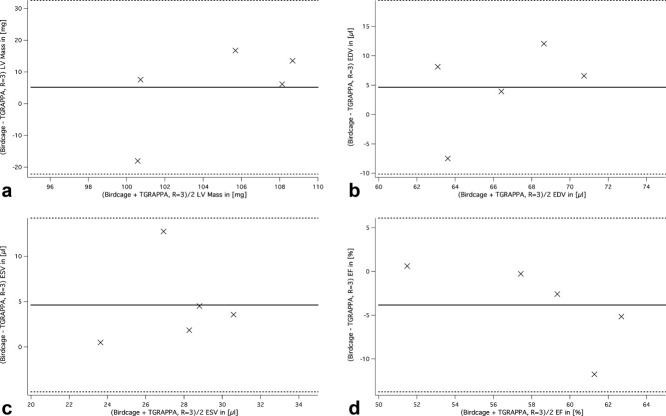
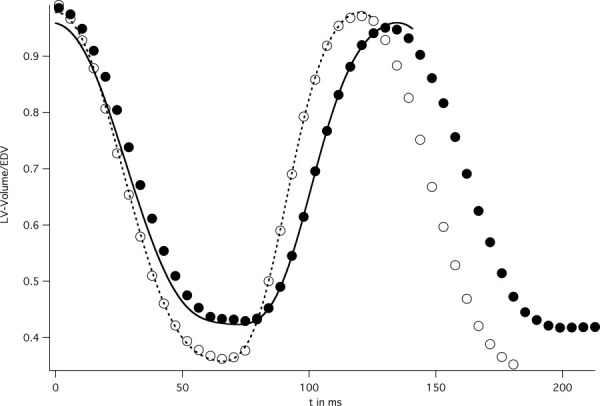
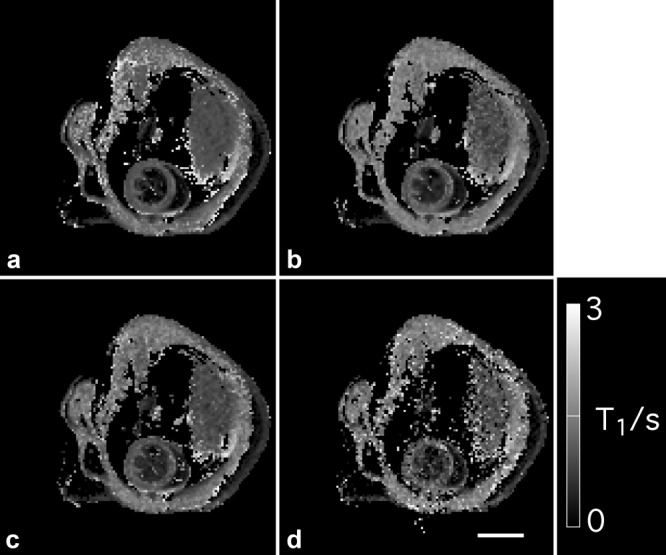
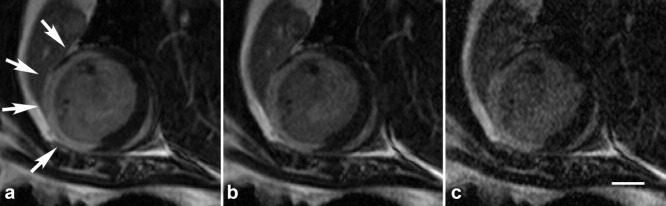
MRI has become an important tool to noninvasively assess global and regional cardiac function, infarct size, or myocardial blood flow in surgically or genetically modified mouse models of human heart disease. Constraints on scan time due to sensitivity to general anesthesia in hemodynamically compromised mice frequently limit the number of parameters available in one imaging session. Parallel imaging techniques to reduce acquisition times require coil arrays, which are technically challenging to design at ultrahigh magnetic field strengths. This work validates the use of an eight-channel volume phased-array coil for cardiac MRI in mice at 9.4 T. Two- and three-dimensional sequences were combined with parallel imaging techniques and used to quantify global cardiac function, T(1)-relaxation times and infarct sizes. Furthermore, the rapid acquisition of functional cine-data allowed for the first time in mice measurement of left-ventricular peak filling and ejection rates under intravenous infusion of dobutamine. The results demonstrate that a threefold accelerated data acquisition is generally feasible without compromising the accuracy of the results. This strategy may eventually pave the way for routine, multiparametric phenotyping of mouse hearts in vivo within one imaging session of tolerable duration.


Figures

FIG. 1
FIG. 1
a–h: Fully encoded axial in vivo gradient echo images of the individual coil elements. The sum-of-squares reconstruction of (i) axial and (k) sagittal coil images illustrate excellent sensitivity to cover the entire heart in each relevant direction for off-centered positioned mouse. The schematic in panel j depicts the location of the individual coil elements (shown in Fig. 1a–h) relative to the mouse (indicated by the grey circle); the dashed black line represents the inner tube of the probe head, and the solid black circle illustrates the coil-array. Scale bar: 5 mm.
FIG. 2
FIG. 2
Midventricular end diastolic (top row) and end systolic frames (bottom row) out of cine trains of 27 images in short-axis orientation. The data were acquired with a quadrature birdcage coil—(a, a′) one or (b, b′) two averages, and (c, c′) with the array—sum-of-square reconstruction, one average. From the dataset acquired for Fig. 2c, c′, accelerated datasets with (d, d′) R = 2, (e, e′) R = 3 and (f, f′) R = 4 were generated, followed by a TGRAPPA reconstruction. The pixel size: 50 × 50 μm2 in-plane; slice thickness: 1 mm. Scale bar: 2 mm.
FIG. 3
FIG. 3
Plot of the mean SNR in anterior (○) and posterior (•) ROI of LV myocardium as a function of number of coils considered for image reconstruction. Coils one to three are the anterior located elements, and, therefore contribute most to the image intensity (mean ± SD, n = 5).
FIG. 4
FIG. 4
SNR quantification for volume and phased array (accelerated and unaccelerated) in five ROIs of the left ventricle, obtained from a midventricular, cine-frame in early systole. The different panels reflect different mouse body weights (and therefore loading conditions). a: BW = 18.3 ± 0.9 g; (b) BW = 22.8 ± 0.9 g; (c) BW = 26.9 ± 1.0 g (n = 5, mean ± SD).
FIG. 5
FIG. 5
Bland-Altman plots for (a) LV mass, (b) EDV, (c) ESV, and (d) EF, obtained from volume coil (2 averages) and R = 3, TGRAPPA datasets. The central line on each graph represents the mean of differences between the datasets, while the two flanking solid lines represent ±2 SD.
FIG. 6
FIG. 6
Representative time volume curves for the entire left ventricle, normalized to the end diastolic volume. The volumes were obtained from threefold undersampled TGRAPPA cine data acquired over two cardiac cycles under baseline conditions (“•” symbols) and under intravenous dobutamine infusion (“○” symbols). Both curves were fitted (lines) to obtain left-ventricular peak-filling and ejection rates.
FIG. 7
FIG. 7
T1-parameter maps in a midventricular short-axis slice for acceleration factors (a) R = 1, (b) R = 2, (c) R = 3, and (d) R = 4, respectively. The maps were masked in the range 0–3 sec to remove outliers from the fit. Twenty-four autocalibration lines were used to reconstruct the missing information from the undersampled datasets. T1-values for various tissue types are listed in Table 2. Scale bar: 5 mm.
FIG. 8
FIG. 8
Contrast-enhanced midventricular short-axis slice out of 3D stack for acceleration factors (a) R = 1, (b) R = 2, and (c) R = 3, respectively. The arrows in Fig. 8a indicate the infarcted area. Scale bar: 2 mm.

Similar articles

Cited by

References

    1. Streif JU, Herold V, Szimtenings M, Lanz TE, Nahrendorf M, Wiesmann F, Rommel E, Haase A. In vivo time-resolved quantitative motion mapping of the murine myocardium with phase contrast MRI. Magn Reson Med. 2003;49:315–321. - PubMed
    1. Herold V, Morchel P, Faber C, Rommel E, Haase A, Jakob PM. In vivo quantitative three-dimensional motion mapping of the murine myocardium with PC-MRI at 17.6 T. Magn Reson Med. 2006;55:1058–1064. - PubMed
    1. Epstein FH, Yang Z, Gilson WD, Berr SS, Kramer CM, French BA. MR tagging early after myocardial infarction in mice demonstrates contractile dysfunction in adjacent and remote regions. Magn Reson Med. 2002;48:399–403. - PubMed
    1. Gilson WD, Yang Z, French BA, Epstein FH. Measurement of myocardial mechanics in mice before and after infarction using multislice displacement-encoded MRI with 3D motion encoding. Am J Physiol Heart Circ Physiol. 2005;288:H1491–H1497. - PubMed
    1. Kober F, Iltis I, Cozzone PJ, Bernard M. Myocardial blood flow mapping in mice using high-resolution spin labeling magnetic resonance imaging: influence of ketamine/xylazine and isoflurane anesthesia. Magn Reson Med. 2005;53:601–606. - PubMed

Publication types