

Determination of spin compartment in arterial spin labeling MRI
- PMID: 20740655
- PMCID: PMC2994958
- DOI: 10.1002/mrm.22601
Determination of spin compartment in arterial spin labeling MRI
Abstract
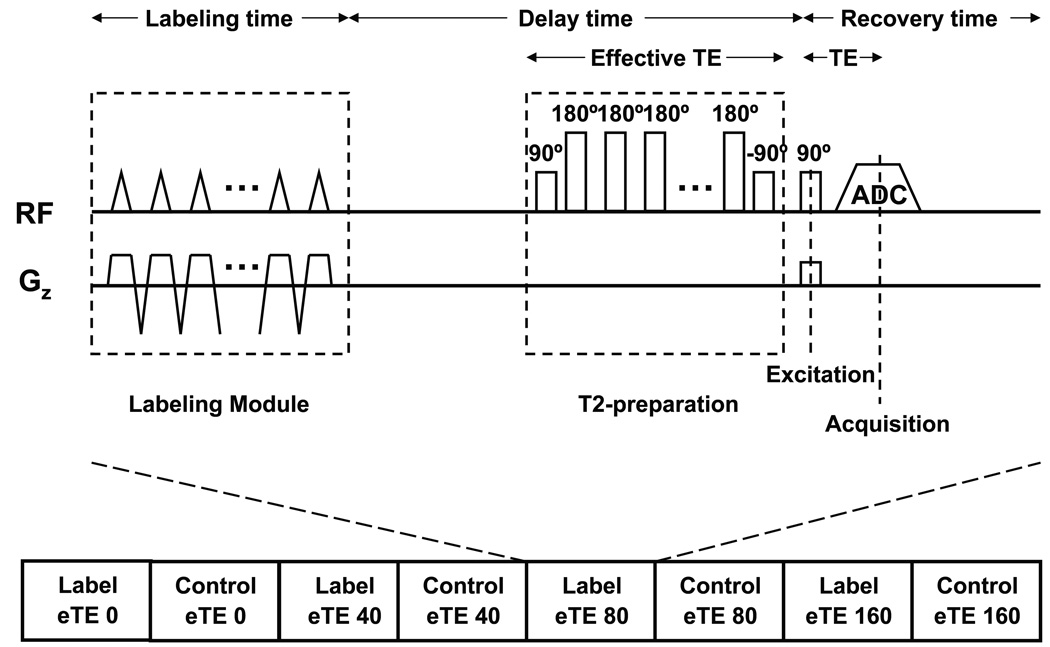
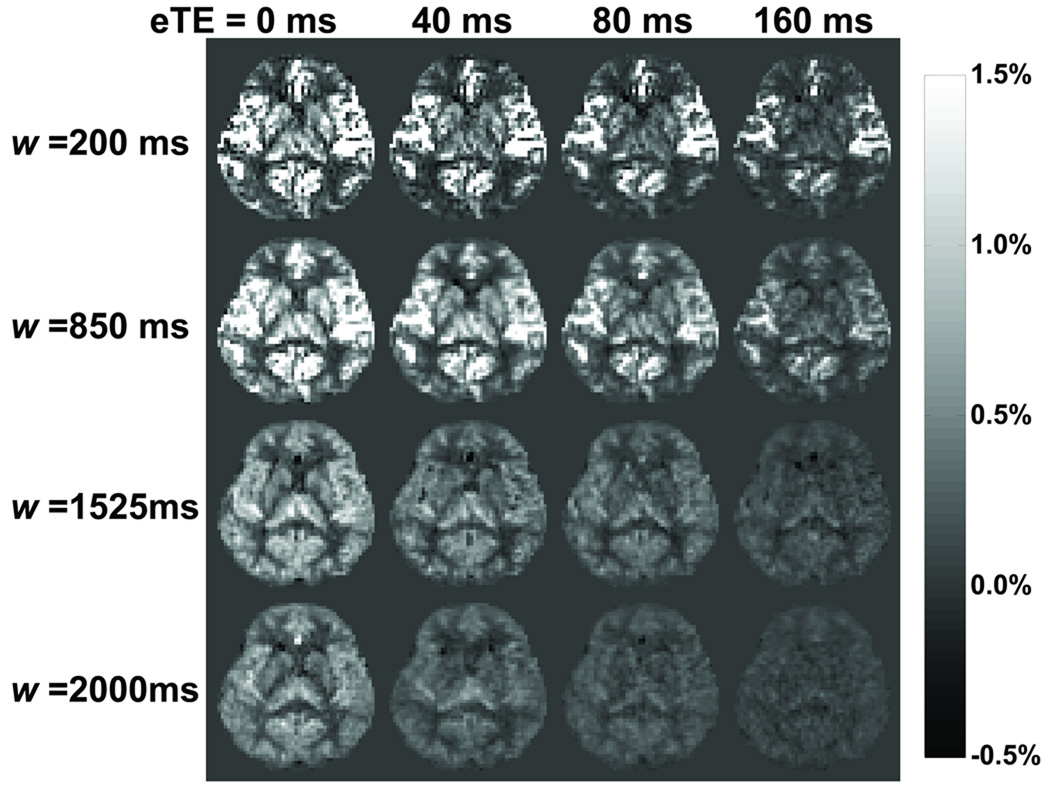
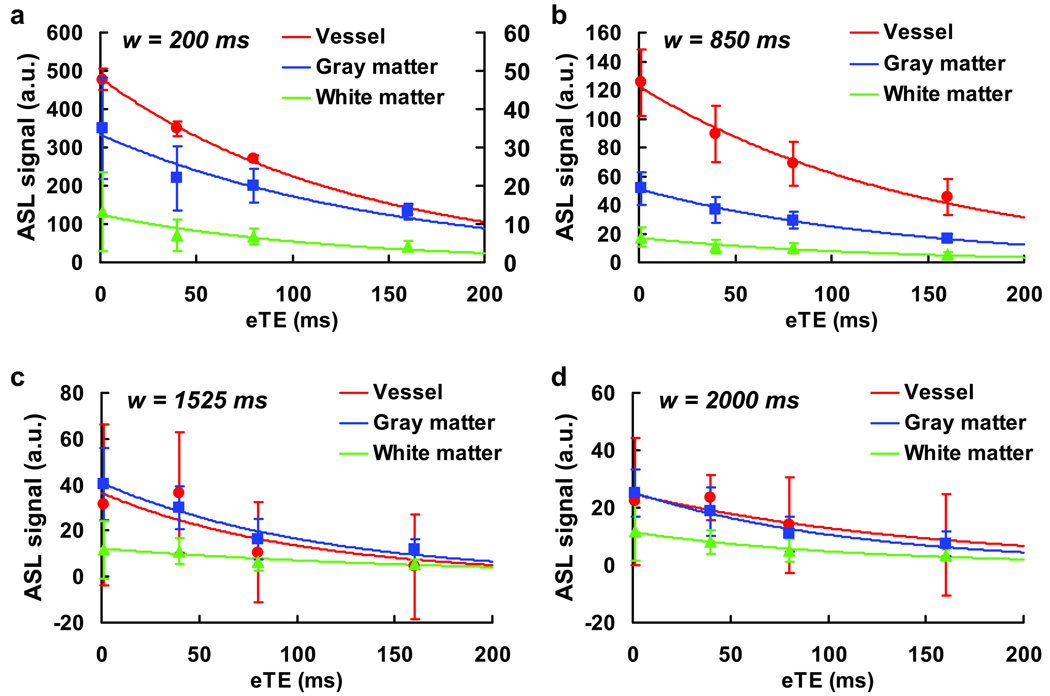
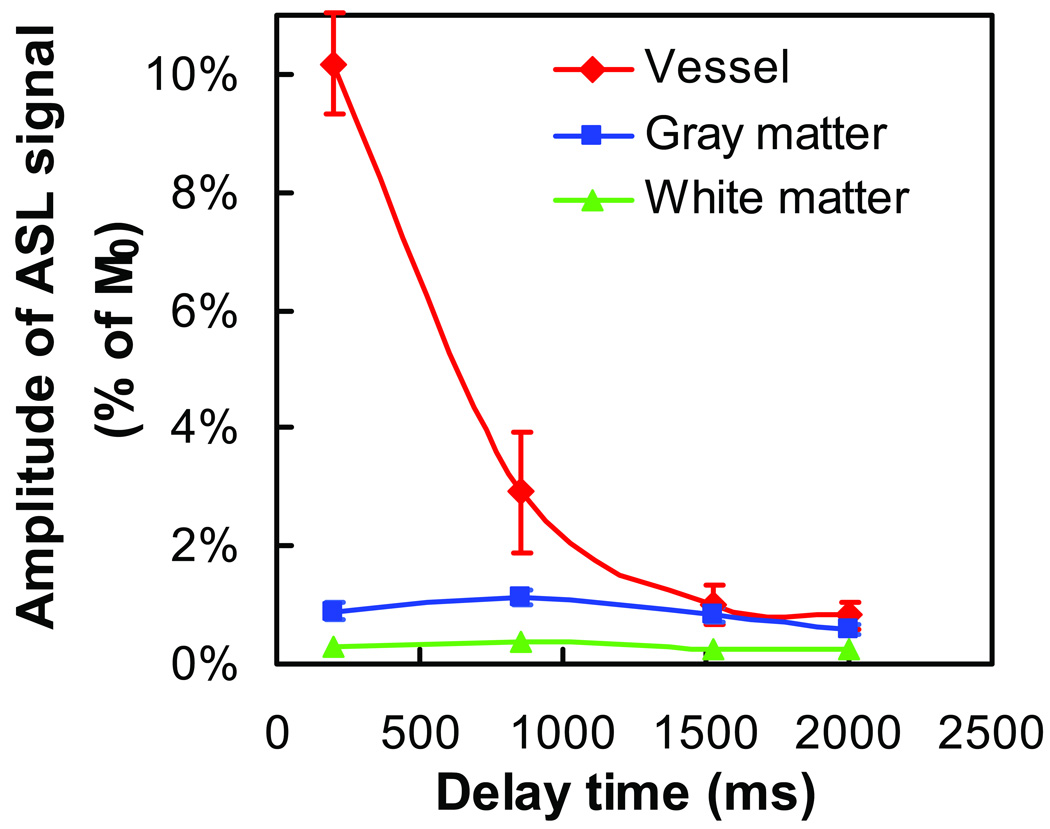
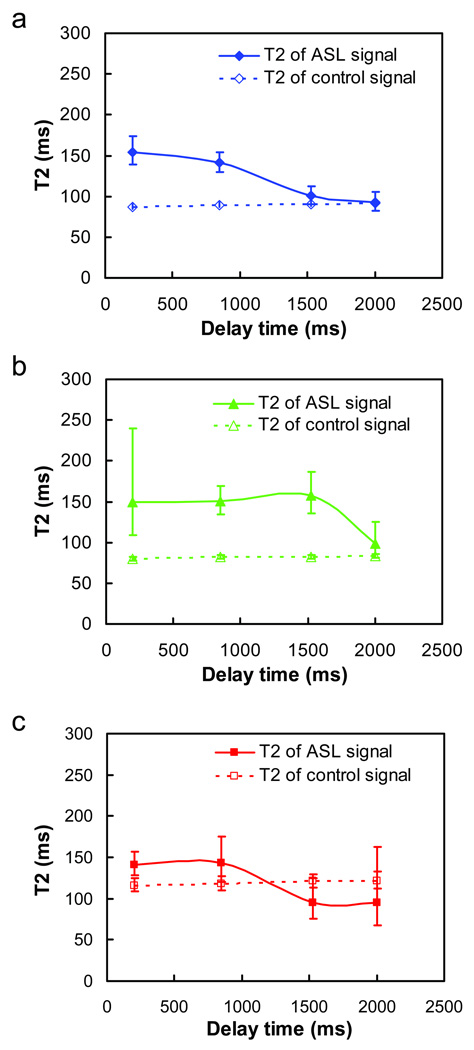
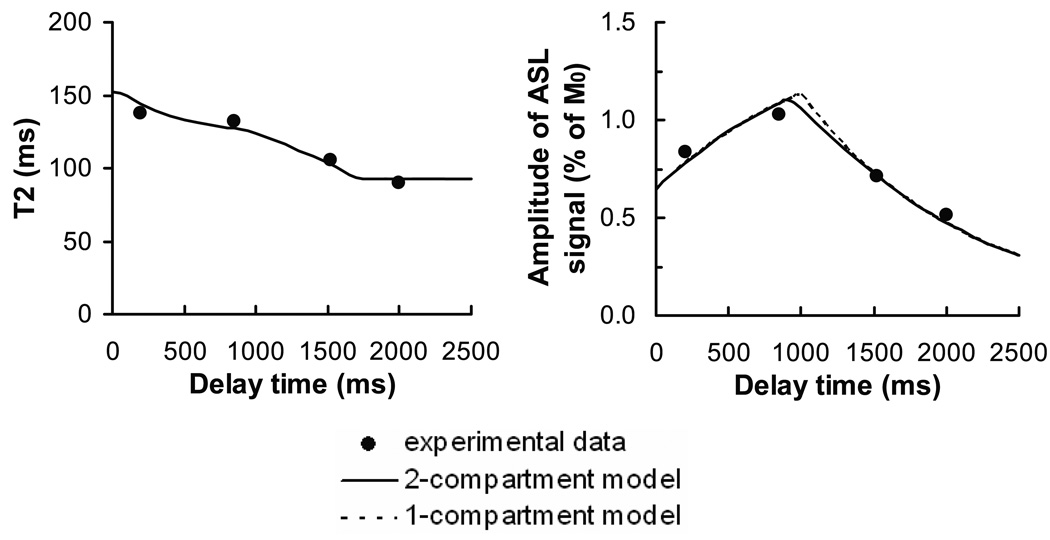
A major difference between arterial-spin-labeling MRI and gold-standard radiotracer blood flow methods is that the compartment localization of the labeled spins in the arterial-spin-labeling image is often ambiguous, which may affect the quantification of cerebral blood flow. In this study, we aim to probe whether the spins are located in the vascular system or tissue by using T2 of the arterial-spin-labeling signal as a marker. We combined two recently developed techniques, pseudo-continuous arterial spin labeling and T2-Relaxation-Under-Spin-Tagging, to determine the T2 of the labeled spins at multiple postlabeling delay times. Our data suggest that the labeled spins first showed the T2 of arterial blood followed by gradually approaching and stabilizing at the tissue T2. The T2 values did not decrease further toward the venous T2. By fitting the experimental data to a two-compartment model, we estimated gray matter cerebral blood flow, arterial transit time, and tissue transit time to be 74.0 ± 10.7 mL/100g/min (mean ± SD, N = 10), 938 ± 156 msec, and 1901 ± 181 msec, respectively. The arterial blood volume was calculated to be 1.18 ± 0.21 mL/100 g. A postlabeling delay time of 2 s is sufficient to allow the spins to completely enter the tissue space for gray matter but not for white matter.
© 2010 Wiley-Liss, Inc.
Figures

Similar articles
-
Cerebral blood flow quantification in swine using pseudo-continuous arterial spin labeling.J Magn Reson Imaging. 2013 Nov;38(5):1111-8. doi: 10.1002/jmri.24066. Epub 2013 Sep 16. J Magn Reson Imaging. 2013. PMID: 24105693
-
Efficient sampling of early signal arrival for estimation of perfusion and transit time in whole-brain arterial spin labeling.Magn Reson Med. 2012 Jul;68(1):179-87. doi: 10.1002/mrm.23222. Epub 2011 Dec 21. Magn Reson Med. 2012. PMID: 22189961
-
An optimized velocity selective arterial spin labeling module with reduced eddy current sensitivity for improved perfusion quantification.Magn Reson Med. 2013 Mar 1;69(3):832-8. doi: 10.1002/mrm.24302. Epub 2012 May 3. Magn Reson Med. 2013. PMID: 22556043
-
Three-dimensional whole-brain perfusion quantification using pseudo-continuous arterial spin labeling MRI at multiple post-labeling delays: accounting for both arterial transit time and impulse response function.NMR Biomed. 2014 Feb;27(2):116-28. doi: 10.1002/nbm.3040. Epub 2013 Oct 16. NMR Biomed. 2014. PMID: 24307572 Free PMC article. Clinical Trial.
-
Perfusion quantification by model-free arterial spin labeling using nonlinear stochastic regularization deconvolution.Magn Reson Med. 2013 Nov;70(5):1470-80. doi: 10.1002/mrm.24587. Epub 2012 Dec 27. Magn Reson Med. 2013. PMID: 23281031
Cited by
-
Quantitative MRI of cerebral arterial blood volume.Open Neuroimag J. 2011;5:136-45. doi: 10.2174/1874440001105010136. Epub 2011 Nov 4. Open Neuroimag J. 2011. PMID: 22253654 Free PMC article.
-
Toward vendor-independent measurement of cerebral venous oxygenation: Comparison of TRUST MRI across three major MRI manufacturers and association with end-tidal CO2.NMR Biomed. 2023 Oct;36(10):e4990. doi: 10.1002/nbm.4990. Epub 2023 Jun 14. NMR Biomed. 2023. PMID: 37315951 Free PMC article.
-
Reliability of quantitative transverse relaxation time mapping with [Formula: see text]-prepared whole brain pCASL.Sci Rep. 2020 Oct 27;10(1):18299. doi: 10.1038/s41598-020-74680-y. Sci Rep. 2020. PMID: 33110203 Free PMC article.
-
Noninvasive blood-brain barrier integrity mapping in patients with high-grade glioma and metastasis by multi-echo time-encoded arterial spin labeling.Magn Reson Med. 2025 May;93(5):2086-2098. doi: 10.1002/mrm.30415. Epub 2025 Jan 8. Magn Reson Med. 2025. PMID: 39777739 Free PMC article.
-
Noninvasive functional imaging of cerebral blood volume with vascular-space-occupancy (VASO) MRI.NMR Biomed. 2013 Aug;26(8):932-48. doi: 10.1002/nbm.2905. Epub 2013 Jan 28. NMR Biomed. 2013. PMID: 23355392 Free PMC article. Review.
References
-
- Mintun MA, Raichle ME, Martin WR, Herscovitch P. Brain oxygen utilization measured with O-15 radiotracers and positron emission tomography. J Nucl Med. 1984;25(2):177–187. - PubMed
-
- Alsop DC, Detre JA. Reduced transit-time sensitivity in noninvasive magnetic resonance imaging of human cerebral blood flow. J Cereb Blood Flow Metab. 1996;16(6):1236–1249. - PubMed
-
- Buxton RB, Frank LR, Wong EC, Siewert B, Warach S, Edelman RR. A general kinetic model for quantitative perfusion imaging with arterial spin labeling. Magn Reson Med. 1998;40(3):383–396. - PubMed
-
- Gonzalez-At JB, Alsop DC, Detre JA. Cerebral perfusion and arterial transit time changes during task activation determined with continuous arterial spin labeling. Magn Reson Med. 2000;43(5):739–746. - PubMed
Publication types
MeSH terms
Substances
Grants and funding
LinkOut - more resources
Full Text Sources
