. 2010 Aug 26;67(4):603-17.
doi: 10.1016/j.neuron.2010.07.016.

Myosin IIb regulates actin dynamics during synaptic plasticity and memory formation

Affiliations

Myosin IIb regulates actin dynamics during synaptic plasticity and memory formation

Christopher S Rex et al. Neuron. .

Abstract

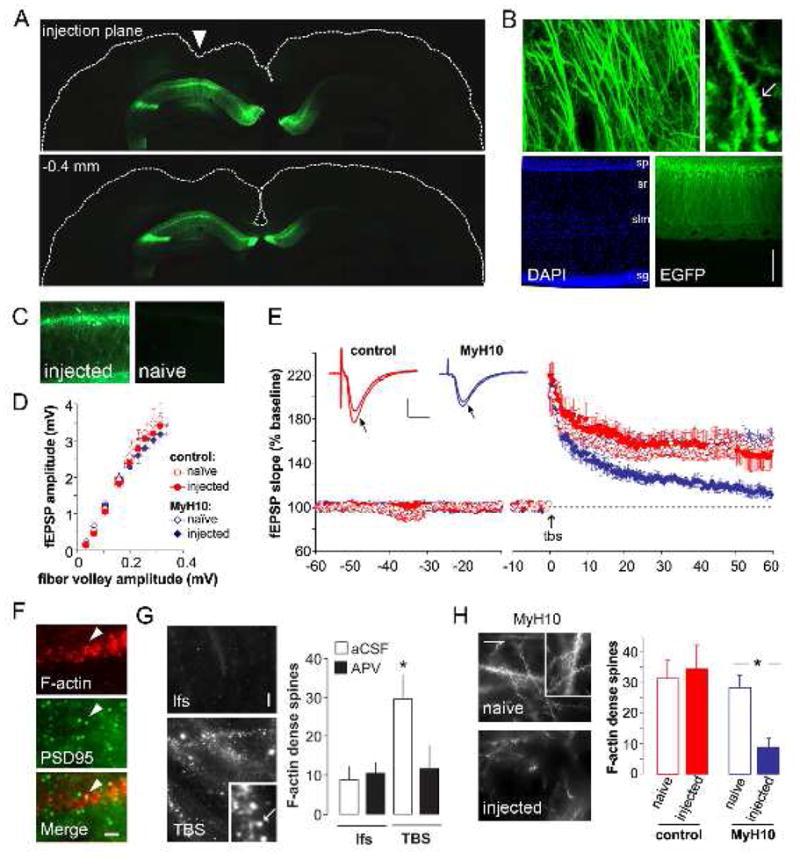
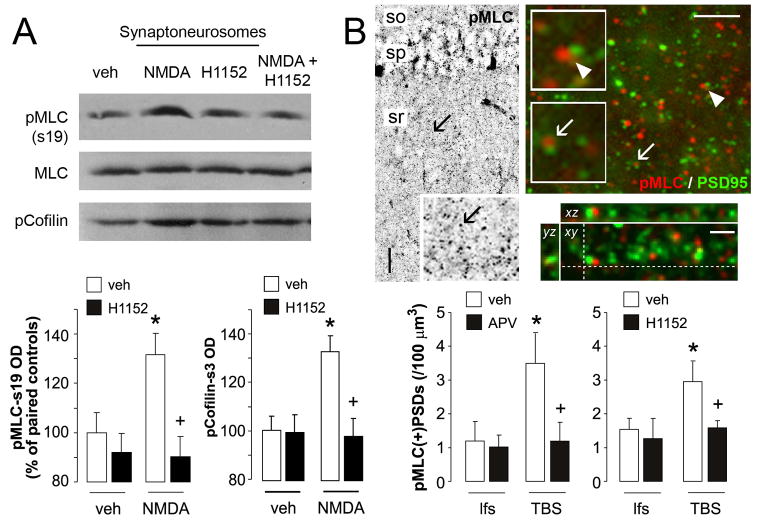
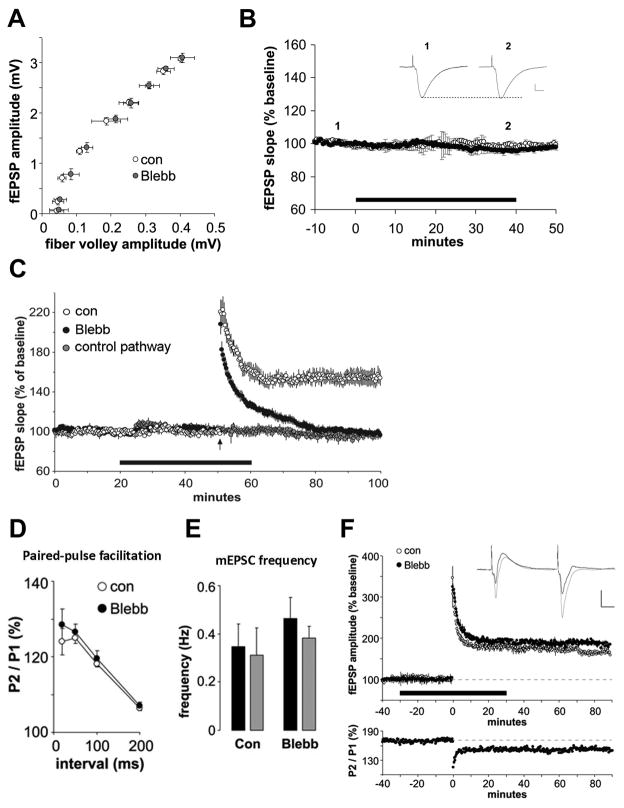
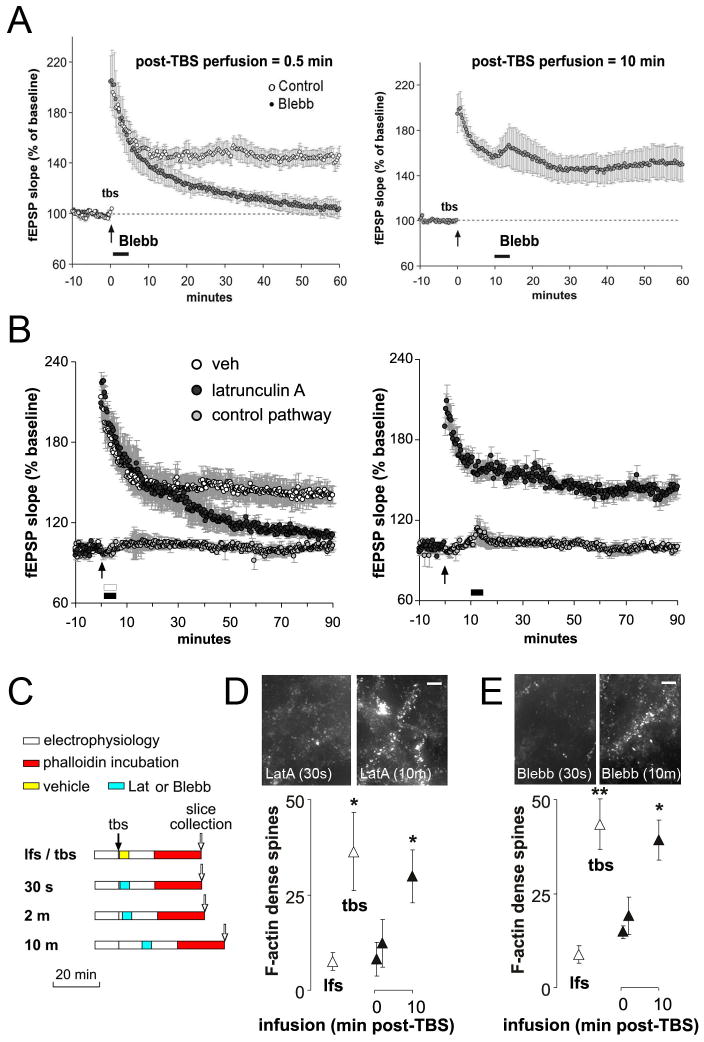
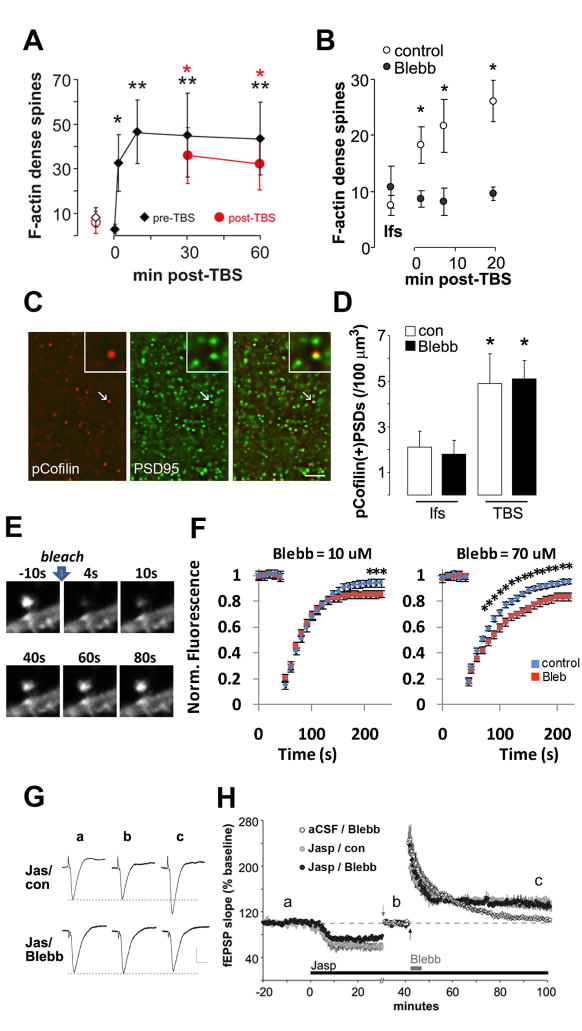
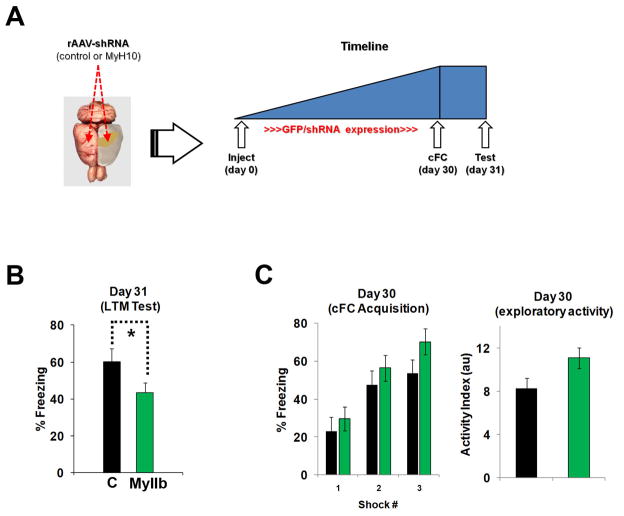
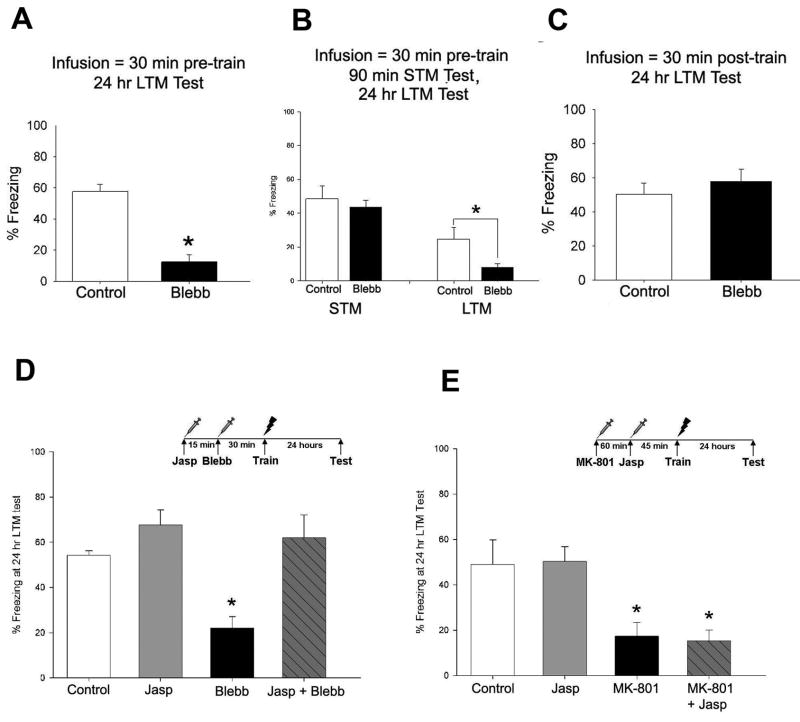
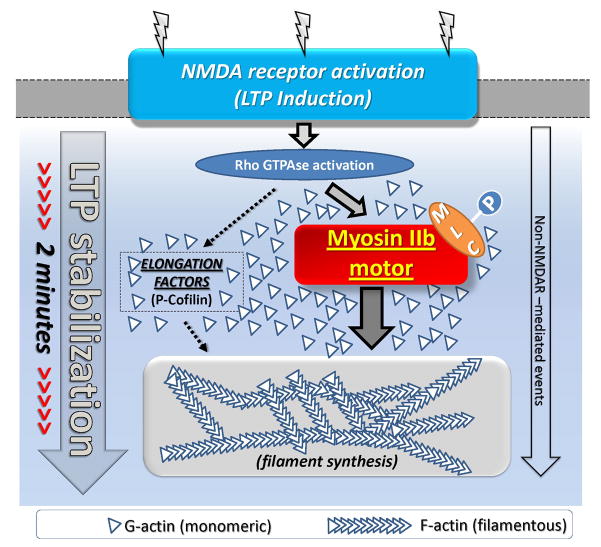
Reorganization of the actin cytoskeleton is essential for synaptic plasticity and memory formation. Presently, the mechanisms that trigger actin dynamics during these brain processes are poorly understood. In this study, we show that myosin II motor activity is downstream of LTP induction and is necessary for the emergence of specialized actin structures that stabilize an early phase of LTP. We also demonstrate that myosin II activity contributes importantly to an actin-dependent process that underlies memory consolidation. Pharmacological treatments that promote actin polymerization reversed the effects of a myosin II inhibitor on LTP and memory. We conclude that myosin II motors regulate plasticity by imparting mechanical forces onto the spine actin cytoskeleton in response to synaptic stimulation. These cytoskeletal forces trigger the emergence of actin structures that stabilize synaptic plasticity. Our studies provide a mechanical framework for understanding cytoskeletal dynamics associated with synaptic plasticity and memory formation.


Figures

Figure 1
Figure 1. Myosin IIb is required for stable LTP and activity-related spine actin polymerization
(A) An adult rat received a unilateral dorsal hippocampal injection (3 ul) of a recombinant adeno-associated virus (rAAV) construct expressing an optimized eGFP cassette. Arrow represents injection needle track. (B) Higher magnification of sections shown in panel A (with inclusion of a DAPI co-stain). Arrow denotes clearly visible dendritic spines. Bar: 100 μm, for lower panels. sp - stratum pyramidale, sr - stratum radiatum, slm - stratum lacunosum moleculare. (C) Photomicrographs of wtGFP expression in dorsal hippocampal slices prepared from injected and contralateral (naïve) hemispheres following unilateral injections (1 ul) of a rAAV co-expressing MyH10 shRNA and wtGFP. Images were collected from fixed slices following electrophysiological recordings. Bar: 20 μm. (D) Input-output relationships for synaptic responses in hippocampus CA1b of slices prepared from dorsal hippocampus 30–40 days after virus injections. No differences between groups were observed (P > 0.05, 1-way RM-ANOVA; n=4 animals/group). (E) Baseline synaptic responses were stable for up to 50 min of recording (minutes -60 to -10) in all groups (n=4 animals/group). Break in x-axis indicates I/O curve collection period (< 5 min). LTP induction (1–2 min post-TBS) was equivalent between all groups (P > 0.05), but slices collected from hemispheres injected with MyH10 shRNA failed to express stable LTP (P = 0.02, 2-way RM-ANOVA for 30–50 min post-TBS). Calibration: 0.5 mV, 10 ms. (F) Photomicrographs show in situ labeling of F-actin by Alexa 568-phalloidin in a proximal dendrite from a CA1 pyramidal neuron in an adult slice. Densely labeled structures were co-labeled with postsynaptic density-95 (PSD95) immunoreactivity (arrowhead) indicating these are dendritic spines. Bar: 2 μm. (G) Spine F-actin labeling in the region of electrophysiological recording for slices receiving baseline stimulation (lfs) or collected after TBS. Slices receiving TBS exhibited numerous densely labeled spine heads (arrow in inset). Bar = 5 μm, 1 μm for inset. Pre-incubations of 50 μM APV (closed bars) or aCSF (open) for 30 min prior to and continuing through in situ phalloidin labeling blocked the TBS-induced increase densely phalloidin-labeled spines (*P < 0.05 for TBS vs. lfs, Tukey’s HSD; P > 0.05 for TBS/aCSF vs. TBS/APV). (H) Photomicrographs show F-actin in str. radiatum labeled in situ with Alexa594-phalloidin following LTP induction by TBS in slices prepared from MyH10 shRNA-injected animals (injected) or the contralateral hemisphere (naïve). Quantification of densely labeled spines in slices that received TBS showed that naïve and control-injected, but not MyH10 shRNA-injected, hemispheres exhibited numbers consistent with TBS induction (P < 0.05, ANOVA; n=3 animals/group; *P < 0.05, Tukey’s HSD).
Figure 2
Figure 2. Myosin light chain phosphorylation is triggered by NMDA receptor activation and LTP induction
(A) Synaptoneurosomes were prepared from adult rats (4–6 weeks) and treated with NMDA (100 μM) or vehicle (veh) for 5 min. Blots (top) show immunoreactivity for phospho-myosin light chain (pMLC), total MLC, or phospho-cofilin. NMDA induced pMLC and pCofilin as assessed by quantification of optical densities (OD) and this was blocked by 5 min pre-treatment with the ROCK inhibitor H1152 (1 μM)(*P<0.05 vs. veh/veh; +P<0.05 vs. NMDA/veh, Tukey’s HSD; n=5–6/group). (B) Adult hippocampal slices received TBS or control stimulation (lfs) and were collected 5–7 min later for phospho-myosin light chain (pMLC) and PSD95 double immunolabeling. Following electrophysiology, slices were processed for tissue extraction using 2–3% Triton X-100 in light fixation and cytoskeleton stabilizing media. Upper left: Intensity-inverted deconvolution photomicrograph shows distribution of punctate labeling for pMLC throughout area CA1. Arrow indicates same puncta in low-magnification image and high-magnification inset. Bar: 5 μm, 10 μm for inset. so, stratum oriens; sp, stratum pyramidale; sr, stratum radiatum. Upper right: Localization of pMLC-ir and PSD95-ir elements. Arrow and arrowhead indicate associated elements from the respective labels identified as pMLC+ PSDs. Bar: 5 μm, 2 μm for insets. Middle-right: Three-dimensional projections of deconvolved z-stack. Dotted lines indicate planes visualized for xz and yz. Bottom: Counts of pMLC+ PSDs in the region of physiological recording for slices receiving TBS or lfs in the presence of 50 μM APV (30 min) or vehicle (veh). A similar pattern of results was obtained when LTP was induced in the presence of H1152 (200 nM; 30 min) (*P < 0.05 vs. veh/lfs; + P < 0.05 vs. veh/TBS; n=9–14/group for APV study, n=7–9/group for H1152 study).
Figure 3
Figure 3. Myosin II ATPase activity is required for NMDAR-dependent synaptic plasticity
Low concentration of blebbistatin (10 μM) was bath applied to adult hippocampal slices. (A) Blebbistatin (Blebb; gray symbols) applied for 1h had no effect on field response input-output relationships in Schaffer collateral-CA1 synapses (P>0.05, RM-ANOVA; n=4/group). In all subsequent experiments that use blebbistatin, the inactive enantiomer was always used as a control (con). (B) Field potentials recorded in CA1 were unaffected by 40 min bath infusion (bar) of 10 μM of inactive (open) or active (closed symbols) blebbistatin (P>0.6, RM-ANOVA). Inset shows representative fEPSPs prior to (1) and during (2) active blebbistatin wash-in. Calibration bar: 0.5 mV, 5 ms. (C) Infusion of blebbistatin blocked stable formation of LTP (P < 0.01 vs. control; RM-ANOVA) at CA3-CA1 synapses induced by TBS (arrow), but did not affect its immediate induction (n=7/group). Control pathway (gray) was unaffected by blebbistatin treatment. (D) Paired pulse facilitation (P2/P1), expressed as the percent increase in response amplitude of pulse 2 vs. pulse 1, was assessed in CA1 str. radiatum at 20, 50, 100, and 200 ms interpulse intervals. Blebbistatin infusion had no effect compared to control compound (n=5/group). (E) Summary of mEPSC frequencies recorded before (closed bars) and after (gray) 30 min infusion of blebbistatin. The drug had no effect on either measure (n=8/group). (F) Transmission at mossy fiber-CA3 synapses in the presence of 50 μM APV was not affected by 10 μM blebbistatin treatment. Mossy fiber potentiation (HFS, arrow) was accompanied by presynaptic facilitation indicated by a 20% reduction in PPF (50 ms interpulse interval; lower graph). The magnitude of mossy fiber potentiation was not different between blebbistatin- and control-treated slices (n=4/group). Inset: Overlaid baseline (black) and 30 min post-HFS (gray) MF-CA3 paired pulse response traces. Calibration: 1 mV, 10 ms.
Figure 4
Figure 4. Myosin II participates in actin-mediated processes during the immediate stabilization of LTP
(A) (Left panel) Short-duration (4 min) local infusion (bar) of 10 μM blebbistatin (Blebb; closed symbols) or control compound (con; open symbols) beginning 30 s after TBS (arrow) prevented stable synaptic potentiation. The inactive compound (open symbols) did not affect LTP (P < 0.01, RM-ANOVA; n=9/group). Blebbistatin applied 10 min post-TBS (right panel) did not affect stable synaptic potentiation (n=10). (B) (Left panel) Local transient infusion (bar) of 0.2 μM latrunculin A (closed symbols) beginning 30 s after TBS (arrow) had no immediate effect but disrupted potentiation compared to vehicle controls (open symbols)(P<0.001; RM-ANOVA; n=10–12/group). Control pathway (gray circles) was unaffected by the infusions or TBS. (Right panel) Latrunculin A applied 10 min post-TBS failed to disrupt LTP (n=7). (C) Schematic shows local infusion and in situ phalloidin labeling paradigm. (D) Representative photomicrographs show labeled F-actin from slices receiving local infusions of latrunculin A (LatA) beginning 30 seconds (left) or 10 minutes post-TBS (right). Plot shows F-actin+ spine quantification from slices receiving local transient infusions of 0.2 μM latrunculin A (closed symbols) or vehicle (open). Latrunculin blocked the induction of densely phalloidin-labeled spines when applied 30 s or 2 min, but not 10 min, after initiating LTP. (*P < 0.05, Tukey’s HSD vs. lfs; n=8–11/group). (E) Experiments performed identically to those in (D) but substituting local infusions of 10 μM blebbistatin (*P < 0.05, **P < 0.01, Tukey’s HSD vs. lfs; n=5–7/group). Bars in D and E: 5 μM.
Figure 5
Figure 5. Myosin II ATPase activity is required for LTP-related dendritic spine actin polymerization
(A) Plot shows quantification (mean ± sem) of F-actin+ spines labeled in situ prior to (pre-; black diamonds) TBS and slices collected 0.5, 2, 7, 30, and 60 min after TBS. Similar results were obtained with post-TBS in situ phalloidin incubation (red circles) for slices collected at 30 and 60 minutes (**P < 0.01, *P < 0.05; Tukey’s HSD vs. control stimulation [lfs]; n=8–12/group). (B) Slices were labeled for F-actin prior to induction of LTP by theta burst stimulation and harvested 2, 7, or 20–30 min post-TBS. Bath applications (40 min, 10 μM) of the active (Blebb), but not inactive (con), isoform of blebbistatin prevented TBS-induced increases in F-actin+ spine density (group means ± sem) in the region containing activated synapses (*P < 0.05, Tukey’s HSD; n=5–7/group). (C-D) Micrographs show double-immunofluorescence for phosphorylated (p) Cofilin and PSD95 following in slices collected 5–7 min post-TBS or lfs. Inset shows synapse indicated by arrow. Bar: 5 μM, 2 μM for inset. Plot shows counts for co-labeled and partially co-labeled elements in the zone of physiological recording (*P < 0.02, ANOVA; n=6/group). (E-F) YFP-actin transfected DIV17 neurons were treated for 15 minutes with 10–70 μM blebbistatin (red, Blebb) or inactive enantiomer (blue) followed by photobleaching (*P < 0.05; ANOVA). (G) Infusions of 0.2 μm jasplakinolide (Jasp; black bar) to slices produced a ~40% reduction in field potential slopes. Stimulus intensity was adjusted (down arrow; break in x-axis) to return field response sizes to pre-Jasp baseline. Local infusions (gray bar) of active (Blebb; closed) or inactive (con; gray) blebbistatin were applied in the continued presence of Jasp beginning 30 sec after TBS (upward arrow). No differences were observed between these groups (P > 0.05; RM-ANOVA; n=6–7/group). Results from experiments performed similarly but in the absence of Jasp (aCSF/Blebb, open; see Fig. 4c) are shown for comparison (starting ten minutes before TBS; n=8).
Figure 6
Figure 6. In vivo knockdown of the myosin IIB motor impairs long term memory formation in the hippocampus
(A) Experimental design for in vivo knockdown of myosin II B expression. Animals were injected with rAAV virus particles expressing shRNAs against MyH10 (n=8) or a control (n=9), non-targeting shRNA. One-month later, all animals were trained for contextual fear conditioning. (B) In vivo knockdown of MyH10 disrupts normal contextual memory formation as compared to controls (F16 = 4.65, *p < 0.05). (C)The left panel shows no difference between groups for post shock freezing during training, indicating that animals were able to perceive the foot shock, acquire the association and express normal freezing behavior (Post first, second and third shocks, respectively: F16 = 0.440, p > 0.05; F16 = 0.385, p > 0.05; F16 = 2.8, p > 0.05). The right panel shows both groups had comparable exploratory activity during training (p>0.05). Error bars represent SEM.
Figure 7
Figure 7. Myosin II motor activity is required for memory consolidation
(A) 30 minute pre-training intra-CA1 infusions of Blebb blocked memory formation, as demonstrated by an absence of freezing behavior at the 24 hr test (F15 = 46.91, P < 0.001). (B) Blebb had no effect on STM assessed 90 minutes after training, indicating that the Blebb delivered 30 minutes prior to training does not interfere with memory acquisition (F15 = 0.32, P > 0.05). LTM was assessed in these same animals. Confirming results in (A), Blebb blocked LTM (F15 = 5.02, P < 0.05). (C) 30 minute post-training intra-CA1 infusions of Blebb had no effect on LTM formation (F14 = 0.71, P > 0.05). Error bars represent SEM. (D) 45 min pre-training intra-CA1 infusions of Jasp had no effect on LTM (P > 0.05), but infusions of Blebb blocked memory formation (*P < 0.05), confirming the results depicted in Figure 5. Pre-treatment with Jasp occluded the Blebb-induced memory deficit (P > 0.05; n= 6/group). (E) Again, 45 minute pre-training intra-CA1 infusions of Jasp alone had no effect on LTM (P > 0.05), but injections of MK-801 blocked memory formation (P < 0.05). The MK-801-induced memory deficit was maintained when MK-801 treatment was combined with intra-CA1 Jasp infusion (P < 0.05; n=9/group). Error bars represent SEM.
Figure 8
Figure 8. Model of Myosin II-mediated F-actin polymerization in dendritic spines
This model outlines a basic mechanism for how LTP induction causes polymeriztion of the F-actin filaments required to stabilize early LTP at CA1 synapses. Coincident synaptic activity, like that arising from TBS, activates NMDARs leading to the activation of LTP induction mechanisms. LTP induction activates Rho GTPase signaling pathways that target Myosin II motors. Activation of Myosin II motor activity induces forces within existing actin networks to polymerize F-actin. In addition, we hypothesize that Rho GTPase signaling activates, in parallel, filament elongation mechanisms, such as cofilin phosphorylation. Together, these effectors of the actin cytoskeleton stimulate synthesis of filaments that stabilize a transient increase in synaptic strength to an early form of long-term potentiation.

Similar articles

Cited by

References

    1. Allison DW, Gelfand VI, Spector I, Craig AM. Role of actin in anchoring postsynaptic receptors in cultured hippocampal neurons: differential attachment of NMDA versus AMPA receptors. J Neurosci. 1998;18:2423–2436. - PMC - PubMed
    1. Anagnostaras SG, Maren S, Fanselow MS. Temporally graded retrograde amnesia of contextual fear after hippocampal damage in rats: within-subjects examination. J Neurosci. 1999;19:1106–1114. - PMC - PubMed
    1. Backouche F, Haviv L, Groswasser D, Bernheim-Groswasser A. Active gels: dynamics of patterning and self-organization. Phys Biol. 2006;3:264–273. - PubMed
    1. Burger C, Gorbatyuk OS, Velardo MJ, Peden CS, Williams P, Zolotukhin S, Reier PJ, Mandel RJ, Muzyczka N. Recombinant AAV viral vectors pseudotyped with viral capsids from serotypes 1, 2, and 5 display differential efficiency and cell tropism after delivery to different regions of the central nervous system. Mol Ther. 2004;10:302–317. - PubMed
    1. Chen LY, Rex CS, Casale MS, Gall CM, Lynch G. Changes in synaptic morphology accompany actin signaling during LTP. J Neurosci. 2007;27:5363–5372. - PMC - PubMed

Publication types

MeSH terms

LinkOut - more resources