

The glycerophospho metabolome and its influence on amino acid homeostasis revealed by brain metabolomics of GDE1(-/-) mice
- PMID: 20797612
- PMCID: PMC2931592
- DOI: 10.1016/j.chembiol.2010.06.009
The glycerophospho metabolome and its influence on amino acid homeostasis revealed by brain metabolomics of GDE1(-/-) mice
Abstract
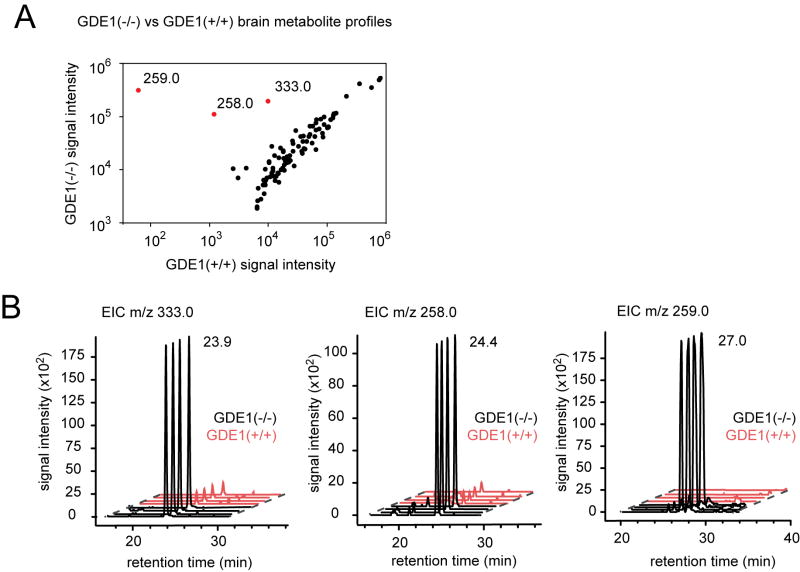
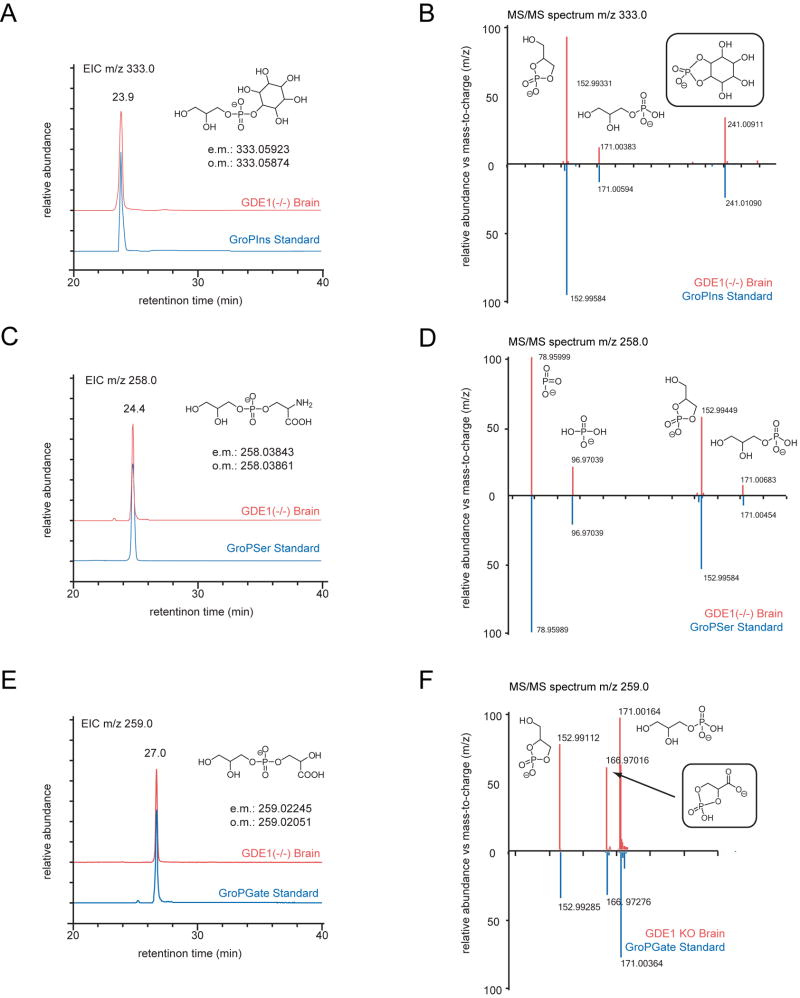
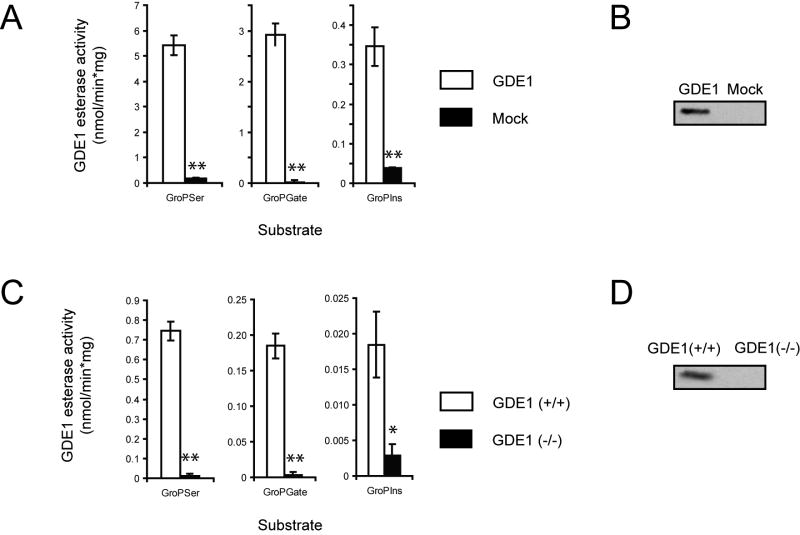
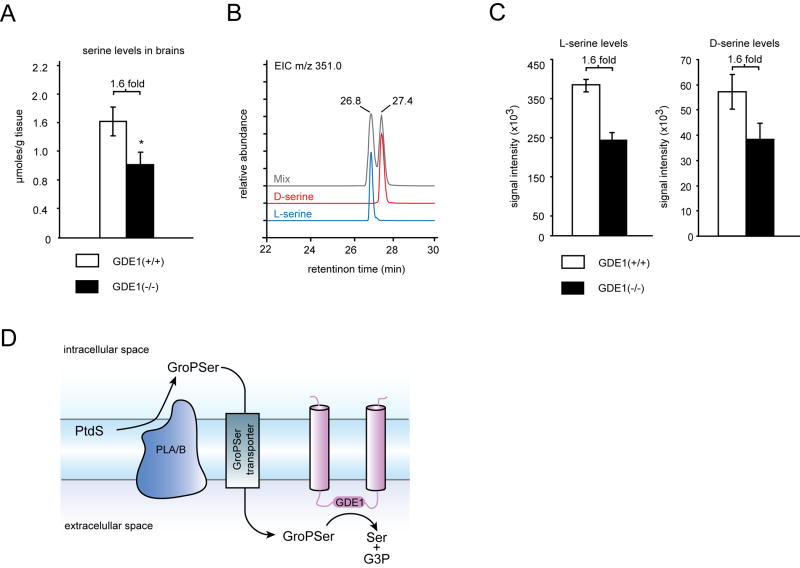
GDE1 is a mammalian glycerophosphodiesterase (GDE) implicated by in vitro studies in the regulation of glycerophophoinositol (GroPIns) and possibly other glycerophospho (GroP) metabolites. Here, we show using untargeted metabolomics that GroPIns is profoundly (>20-fold) elevated in brain tissue from GDE1(-/-) mice. Furthermore, two additional GroP metabolites not previously identified in eukaryotic cells, glycerophosphoserine (GroPSer) and glycerophosphoglycerate (GroPGate), were also highly elevated in GDE1(-/-) brains. Enzyme assays with synthetic GroP metabolites confirmed that GroPSer and GroPGate are direct substrates of GDE1. Interestingly, our metabolomic profiles also revealed that serine (both L-and D-) levels were significantly reduced in brains of GDE1(-/-) mice. These findings designate GroPSer as a previously unappreciated reservoir for free serine in the nervous system and suggest that GDE1, through recycling serine from GroPSer, may impact D-serine-dependent neural signaling processes in vivo.
Copyright (c) 2010 Elsevier Ltd. All rights reserved.
Figures
Similar articles
-
Anandamide biosynthesis catalyzed by the phosphodiesterase GDE1 and detection of glycerophospho-N-acyl ethanolamine precursors in mouse brain.J Biol Chem. 2008 Apr 4;283(14):9341-9. doi: 10.1074/jbc.M707807200. Epub 2008 Jan 27. J Biol Chem. 2008. PMID: 18227059 Free PMC article.
-
Genomic organization, characterization, and molecular 3D model of GDE1, a novel mammalian glycerophosphoinositol phosphodiesterase.Gene. 2006 Apr 12;371(1):144-53. doi: 10.1016/j.gene.2005.11.023. Epub 2006 Feb 9. Gene. 2006. PMID: 16472945
-
Characterization of mice lacking candidate N-acyl ethanolamine biosynthetic enzymes provides evidence for multiple pathways that contribute to endocannabinoid production in vivo.Mol Biosyst. 2010 Aug;6(8):1411-8. doi: 10.1039/c000237b. Epub 2010 Apr 14. Mol Biosyst. 2010. PMID: 20393650 Free PMC article.
-
Metabolomics in severe traumatic brain injury: a scoping review.BMC Neurosci. 2023 Oct 16;24(1):54. doi: 10.1186/s12868-023-00824-1. BMC Neurosci. 2023. PMID: 37845610 Free PMC article.
-
Advances in Chiral Metabolomic Profiling and Biomarker Discovery.Methods Mol Biol. 2025;2855:85-101. doi: 10.1007/978-1-0716-4116-3_5. Methods Mol Biol. 2025. PMID: 39354302 Review.
Cited by
-
Steady-state hydrogen peroxide induces glycolysis in Staphylococcus aureus and Pseudomonas aeruginosa.J Bacteriol. 2014 Jul;196(14):2499-513. doi: 10.1128/JB.01538-14. Epub 2014 Apr 25. J Bacteriol. 2014. PMID: 24769698 Free PMC article.
-
In situ profiling reveals metabolic alterations in the tumor microenvironment of ovarian cancer after chemotherapy.NPJ Precis Oncol. 2023 Nov 3;7(1):115. doi: 10.1038/s41698-023-00454-0. NPJ Precis Oncol. 2023. PMID: 37923835 Free PMC article.
-
Ether lipid generating enzyme AGPS alters the balance of structural and signaling lipids to fuel cancer pathogenicity.Proc Natl Acad Sci U S A. 2013 Sep 10;110(37):14912-7. doi: 10.1073/pnas.1310894110. Epub 2013 Aug 26. Proc Natl Acad Sci U S A. 2013. PMID: 23980144 Free PMC article.
-
Inositol phosphate recycling regulates glycolytic and lipid metabolism that drives cancer aggressiveness.ACS Chem Biol. 2014 Jun 20;9(6):1340-50. doi: 10.1021/cb5001907. Epub 2014 Apr 28. ACS Chem Biol. 2014. PMID: 24738946 Free PMC article.
-
Development of terphenyl-2-methyloxazol-5(4H)-one derivatives as selective reversible MAGL inhibitors.J Enzyme Inhib Med Chem. 2017 Dec;32(1):1240-1252. doi: 10.1080/14756366.2017.1375484. J Enzyme Inhib Med Chem. 2017. PMID: 28936880 Free PMC article.
References
-
- Bajad SU, Lu W, Kimball EH, Yuan J, Peterson C, Rabinowitz JD. Separation and quantitation of water soluble cellular metabolites by hydrophilic interaction chromatography-tandem mass spectrometry. J Chromatogr. 2006;1125:76–88. - PubMed
-
- Chiang KP, Niessen S, Saghatelian A, Cravatt BF. An enzyme that regulates ether lipid signaling pathways in cancer annotated by multidimensional profiling. Chem Biol. 2006;13:1041–1050. - PubMed
Publication types
MeSH terms
Substances
Grants and funding
LinkOut - more resources
Full Text Sources
Molecular Biology Databases
