. 2010 Aug 27;329(5995):1081-5.
doi: 10.1126/science.1185718.

Optimally interacting minds

Affiliations

Optimally interacting minds

Bahador Bahrami et al. Science. .

Abstract

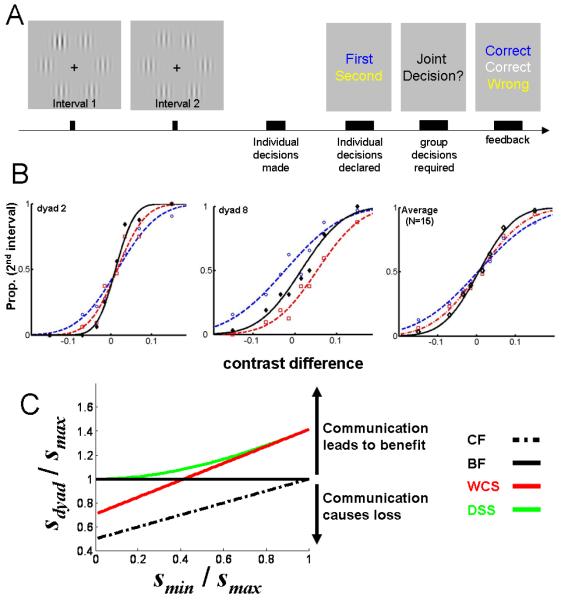
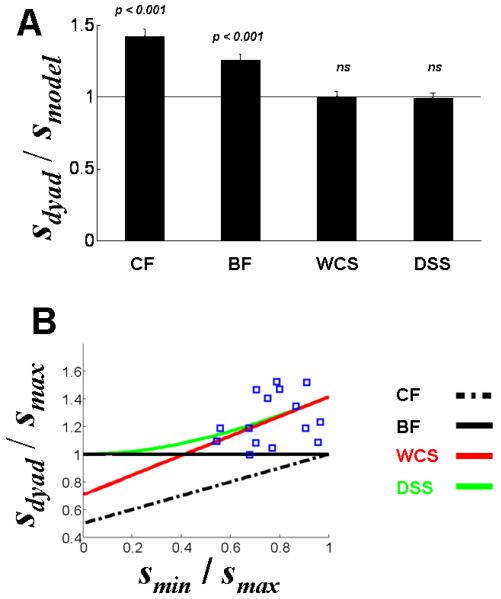
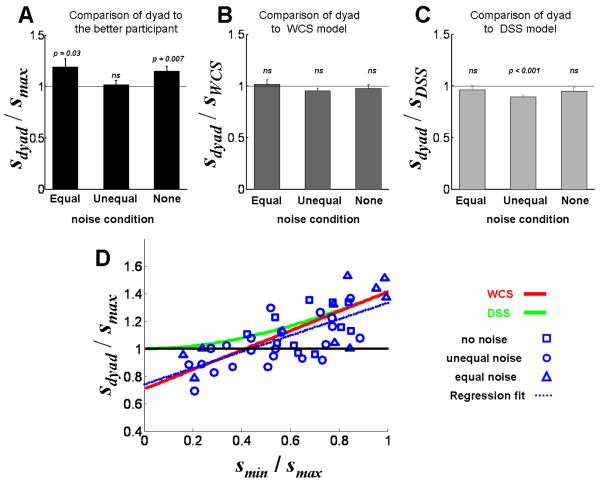
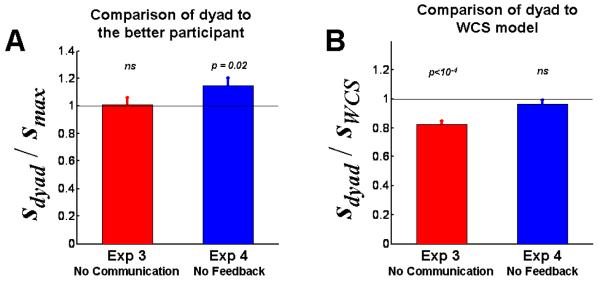
In everyday life, many people believe that two heads are better than one. Our ability to solve problems together appears to be fundamental to the current dominance and future survival of the human species. But are two heads really better than one? We addressed this question in the context of a collective low-level perceptual decision-making task. For two observers of nearly equal visual sensitivity, two heads were definitely better than one, provided they were given the opportunity to communicate freely, even in the absence of any feedback about decision outcomes. But for observers with very different visual sensitivities, two heads were actually worse than the better one. These seemingly discrepant patterns of group behavior can be explained by a model in which two heads are Bayes optimal under the assumption that individuals accurately communicate their level of confidence on every trial.


Figures

Figure 1
Figure 1
(A) Experimental paradigm. Each trial consisted of two observation intervals. In each interval, six vertically oriented Gabor patches were displayed equidistantly around an imaginary circle (duration: 85 ms). In either the first or second interval, there was one oddball target that had slightly higher contrast than all the others (in this example, upper left target in interval 1). (B) Two example psychometric functions and the group average in Experiment 1. The proportion of trials in which the oddball was reported to be in the second interval is plotted against the contrast difference at the oddball location (i.e. contrast in the second interval minus contrast in the first). A highly sensitive observer would produce a steeply rising psychometric function with a large slope. Blue circles: performance of the less sensitive observer (smin) of the dyad; red squares: performance of the more sensitive observer (smax); black diamonds: performance of the dyad (sdyad). The blue and red curves are the best fit to a cumulative Gaussian function (16); the black curve is the prediction of the weighted confidence-sharing model. (C) The predictions of the four models (see Eqs. 1-4). The x-axis shows the ratio of individual sensitivities (smin/smax), with values near one corresponding to dyad members with similar sensitivity and values near zero to dyad members with very different sensitivity. The y-axis shows the ratio of dyad sensitivity to the more sensitive member (sdyad/smax). Values above the horizontal line indicate communication benefit; in this range the dyad is better than the more sensitive observer. The red curve, which corresponds to the weighted confidence sharing (WCS) model, is above the horizontal line only if smin/smax is larger than about 0.4, reflecting the prediction that communication by weighted confidence sharing is beneficial only if dyad members have approximately the same competence. The green curve, which corresponds to the direct signal sharing (DSS) model, never crosses the horizontal line, so for this model communication will invariably be beneficial. Dot-dashed and solid black lines indicate the coin flip (CF) and behaviour and feedback (BF) models, respectively.
Figure 2
Figure 2
The results of Experiments 1. (A) The ratio of the dyad slope to the slope predicted by each model is plotted. CF: coin flip; BF: behaviour and feedback (this comparison also depicts collective benefit over the more sensitive observer); WCS: weighted confidence sharing; DSS: direct signal sharing. Error bars are SEM (N=15). (B) Distribution of data points and model predictions. Collective benefit (sdyad/smax) is plotted against relative sensitivity (smin/smax).
Figure 3
Figure 3
The results of Experiment 2. (A) Ratio of the dyad slope to the maximum individual slope for the three noise conditions (see main text). The line at sdyad/smax=1 corresponds to the case where the dyad is doing exactly as well as the more sensitive member. Values above and below the line correspond to benefit and loss due to communication, respectively. (B) Ratio of the dyad slope to the slope predicted by the weighted confidence sharing (WCS) model, the latter denoted sWCS. This ratio was not statistically significantly different from zero for any of the noise conditions. (C) Ratio of the dyad slope to the slope of the direct signal sharing (DSS) model. For the unequal noise condition, this ratio was significantly smaller than 1 (p<10−4). (D) Distribution of data points and model predictions (the latter taken from Fig. 1C). Collective benefit (sdyad/smax) is plotted against relative sensitivity (smin/smax). Each dyad contributed four sets of data points (one triangle for ‘Equal’, one square for ‘None’ and two circles for ‘Unequal’ conditions). In panels A-C, error bars are SEM (N=11 data points for ‘Equal’ and ‘None’ conditions; N=22 for ‘Unequal’ condition).
Figure 4
Figure 4
The results of Experiment 3-4. Y-axis conventions are the same as figure 3A and 3B. (A) Collective benefit (sdyad/smax) is plotted for Experiment 3 (red; without communication) and for Experiment 4 (blue; without feedback). (B) Ratio of the dyad slope to the slope predicted by the weighted confidence sharing (WCS) model for Experiment 3 (red; without communication), and Experiment 4 (blue; without feedback). In all panels, error bars are SEM (N=14 for Experiment 3; N=11 for Experiment 4).

Comment in

  • Behavior. Decisions made better.
    Ernst MO. Ernst MO. Science. 2010 Aug 27;329(5995):1022-3. doi: 10.1126/science.1194920. Science. 2010. PMID: 20798305 No abstract available.
  • Optimizing scientific reasoning.
    Skoyles JR. Skoyles JR. Science. 2010 Dec 10;330(6010):1477. doi: 10.1126/science.330.6010.1477-b. Science. 2010. PMID: 21148374 No abstract available.

Similar articles

Cited by

References

    1. Bovens L, Hartmann S. Bayesian epistemology. Oxford University Press; Oxford: 2003.
    1. Nitzan S, Paroush J. Collective decision making: an economic outlook. Cambridge University Press; Cambridge: 1985.
    1. Alais D, Burr D. Curr. Biol. 2004;14:257. - PubMed
    1. Ernst MO, Banks MS. Nature. 2002;415:429. - PubMed
    1. Kording KP, Wolpert DM. Nature. 2004;427:244. - PubMed

Publication types