

Label-free imaging, detection, and mass measurement of single viruses by surface plasmon resonance
- PMID: 20798340
- PMCID: PMC2941305
- DOI: 10.1073/pnas.1005264107
Label-free imaging, detection, and mass measurement of single viruses by surface plasmon resonance
Abstract
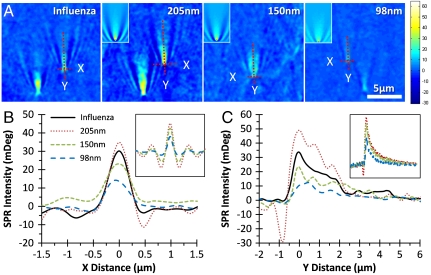
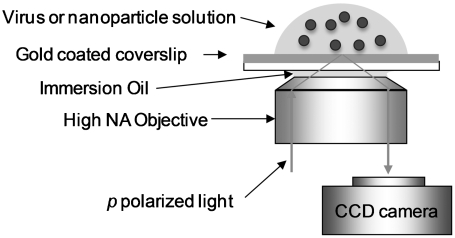
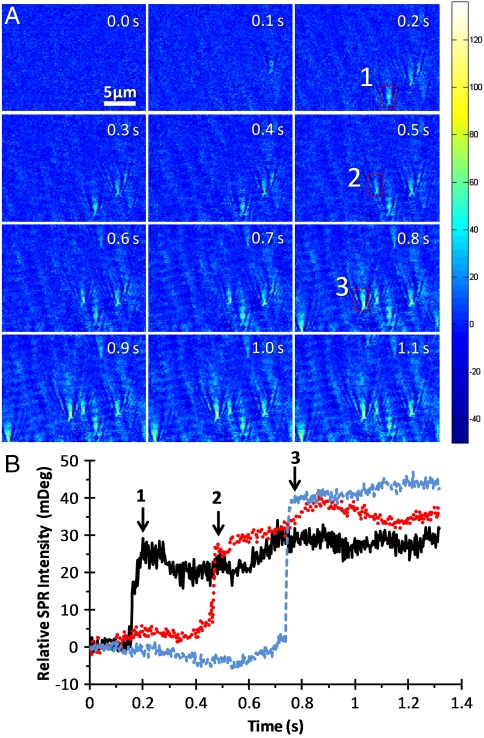
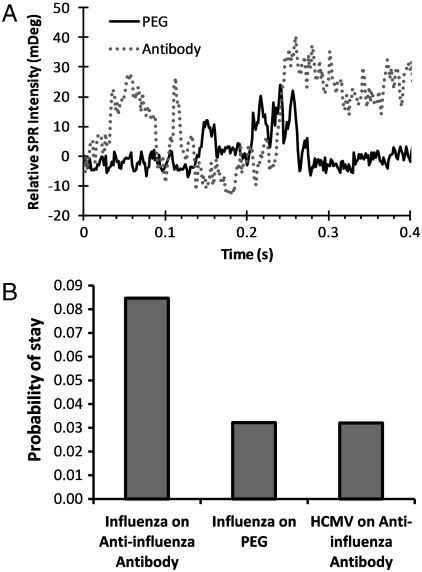
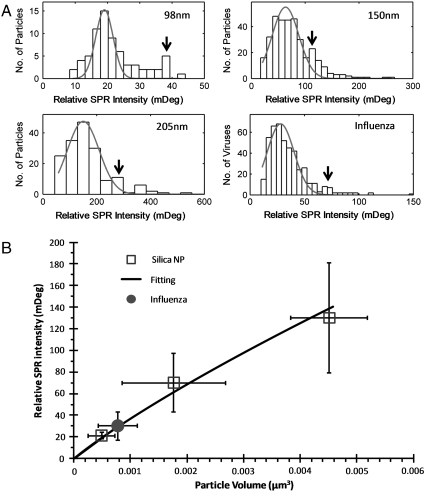
We report on label-free imaging, detection, and mass/size measurement of single viral particles in solution by high-resolution surface plasmon resonance microscopy. Diffraction of propagating plasmon waves along a metal surface by the viral particles creates images of the individual particles, which allow us to detect the binding of the viral particles to surfaces functionalized with and without antibodies. We show that the intensity of the particle image is related to the mass of the particle, from which we determine the mass and mass distribution of influenza viral particles with a mass detection limit of approximately 1 ag (or 0.2 fg/mm(2)). This work demonstrates a multiplexed method to measure the masses of individual viral particles and to study the binding activity of the viral particles.
Conflict of interest statement
The authors declare no conflict of interest.
Figures
Similar articles
-
Application of surface plasmon resonance imaging technique for the detection of single spherical biological submicrometer particles.Anal Biochem. 2015 Oct 1;486:62-9. doi: 10.1016/j.ab.2015.06.022. Epub 2015 Jun 18. Anal Biochem. 2015. PMID: 26095398
-
Plasmonics-Based Detection of Virus Using Sialic Acid Functionalized Gold Nanoparticles.Methods Mol Biol. 2017;1571:109-116. doi: 10.1007/978-1-4939-6848-0_7. Methods Mol Biol. 2017. PMID: 28281252 Free PMC article.
-
Detection of swine-origin influenza A (H1N1) viruses using a localized surface plasmon coupled fluorescence fiber-optic biosensor.Biosens Bioelectron. 2010 Nov 15;26(3):1068-73. doi: 10.1016/j.bios.2010.08.060. Epub 2010 Aug 26. Biosens Bioelectron. 2010. PMID: 20855191 Free PMC article.
-
A unified view of propagating and localized surface plasmon resonance biosensors.Anal Bioanal Chem. 2004 Aug;379(7-8):920-30. doi: 10.1007/s00216-004-2708-9. Epub 2004 Jul 28. Anal Bioanal Chem. 2004. PMID: 15338088 Review.
-
Chemokine Detection Using Receptors Immobilized on an SPR Sensor Surface.Methods Enzymol. 2016;570:1-18. doi: 10.1016/bs.mie.2015.09.013. Epub 2015 Nov 14. Methods Enzymol. 2016. PMID: 26921939 Review.
Cited by
-
3D nanointerface enhanced optical microfiber for real-time detection and sizing of single nanoparticles.Chem Eng J. 2021 Mar 1;407:127143. doi: 10.1016/j.cej.2020.127143. Epub 2020 Sep 29. Chem Eng J. 2021. PMID: 33013189 Free PMC article.
-
Carbon nanotube thin film biosensors for sensitive and reproducible whole virus detection.Theranostics. 2012;2(3):251-7. doi: 10.7150/thno.3726. Epub 2012 Mar 1. Theranostics. 2012. PMID: 22448194 Free PMC article.
-
Direct imaging of dynamic heterogeneous lithium-gold interaction at the electrochemical interface during the charging/discharging processes.Chem Sci. 2024 Jan 17;15(9):3192-3202. doi: 10.1039/d3sc05021a. eCollection 2024 Feb 28. Chem Sci. 2024. PMID: 38425538 Free PMC article.
-
Real-Time Detection of LAMP Products of African Swine Fever Virus Using Fluorescence and Surface Plasmon Resonance Method.Biosensors (Basel). 2022 Apr 3;12(4):213. doi: 10.3390/bios12040213. Biosensors (Basel). 2022. PMID: 35448273 Free PMC article.
-
Influence of Fixation and Permeabilization on the Mass Density of Single Cells: A Surface Plasmon Resonance Imaging Study.Front Chem. 2019 Aug 23;7:588. doi: 10.3389/fchem.2019.00588. eCollection 2019. Front Chem. 2019. PMID: 31508410 Free PMC article.
References
-
- Henk MG. Particle size measurements: fundamentals, practice, quality. 1st Ed. New York: Springer; 2009.
-
- Le TT, Saveyn P, Hoa HD, Van der Meeren P. Determination of heat-induced effects on the particle size distribution of casein micelles by dynamic light scattering and nanoparticle tracking analysis. Int Dairy J. 2008;18(12):1090–1096.
-
- Armani AM, Kulkarni RP, Fraser SE, Flagan RC, Vahala KJ. Label-free, single-molecule detection with optical microcavities. Science. 2007;317(5839):783–787. - PubMed
-
- Zhu JG, et al. On-chip single nanoparticle detection and sizing by mode splitting in an ultrahigh-Q microresonator. Nat Photonics. 2010;4(1):46–49.
Publication types
MeSH terms
Substances
Grants and funding
LinkOut - more resources
Full Text Sources
Other Literature Sources
