. 2010 Oct 15;107(8):1002-10.
doi: 10.1161/CIRCRESAHA.110.217018. Epub 2010 Aug 26.

Local regulation of arterial L-type calcium channels by reactive oxygen species

Affiliations

Local regulation of arterial L-type calcium channels by reactive oxygen species

Gregory C Amberg et al. Circ Res. .

Abstract

Rationale: Reactive oxygen species (ROS) are implicated in the development of cardiovascular disease, and oxidants are important signaling molecules in many cell types. Recent evidence suggests that localized subcellular compartmentalization of ROS generation is an important feature of ROS signaling. However, mechanisms that transduce localized subcellular changes in redox status to functionally relevant changes in cellular processes such as Ca(2+) influx are poorly understood.

Objective: To test the hypothesis that ROS regulate L-type Ca(2+) channel activity in cerebral arterial smooth muscle.

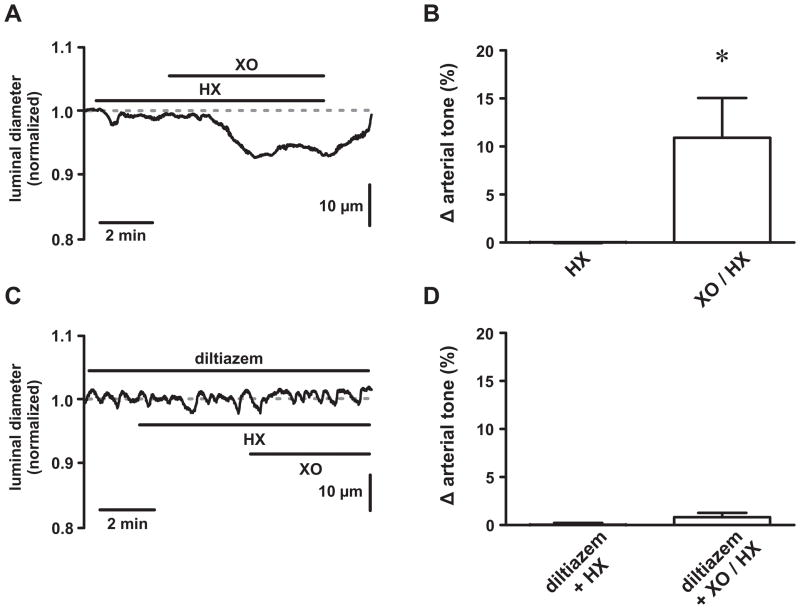
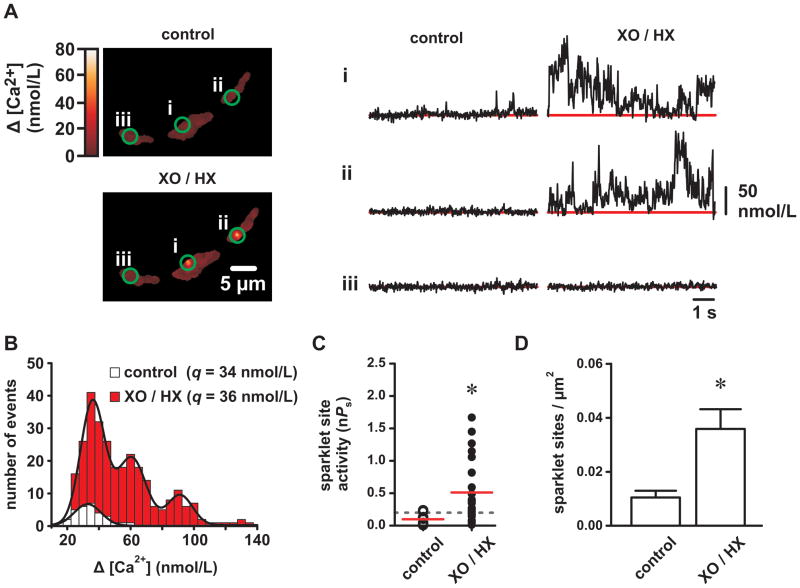
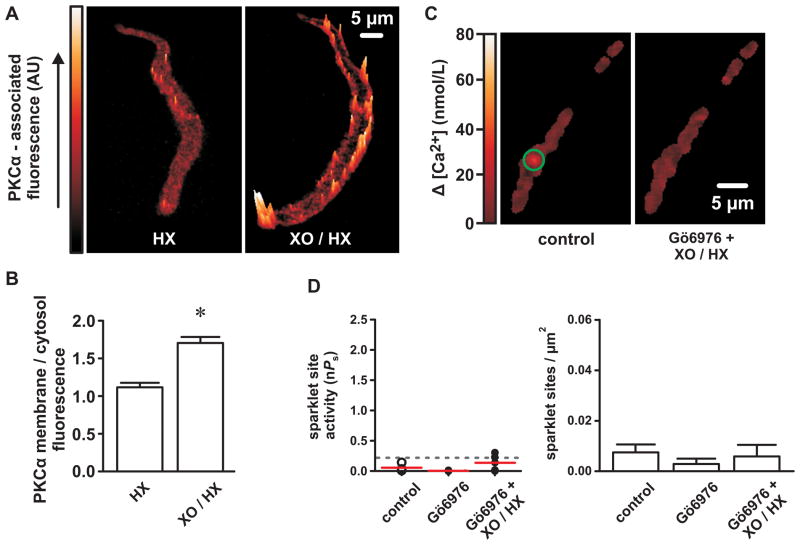
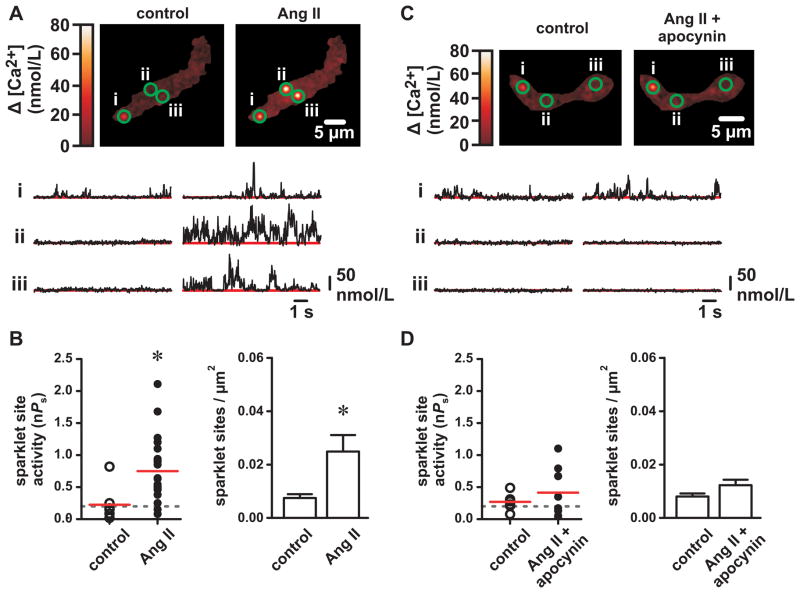
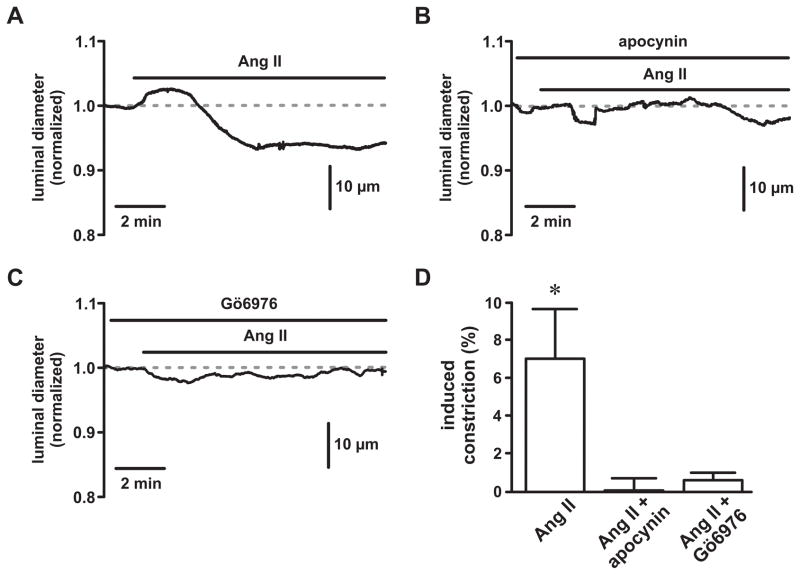
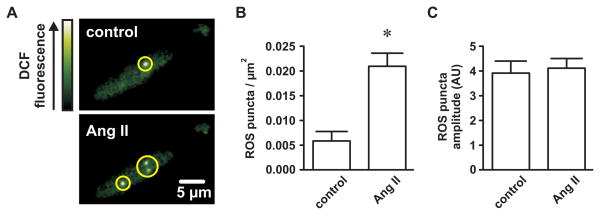
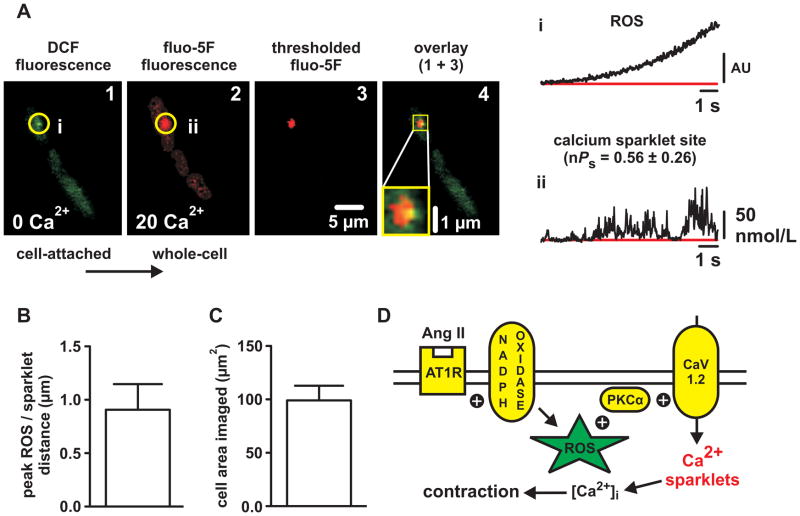
Methods and results: Using a total internal reflection fluorescence imaging-based approach, we found that highly localized subplasmalemmal generation of endogenous ROS preceded and colocalized with sites of enhanced L-type Ca(2+) channel sparklet activity in isolated cerebral arterial smooth muscle cells. Consistent with this observation and our hypothesis, exogenous ROS increased localized L-type Ca(2+) channel sparklet activity in isolated arterial myocytes via activation of protein kinase Cα and when applied to intact cerebral arterial segments, exogenous ROS increased arterial tone in an L-type Ca(2+) channel-dependent fashion. Furthermore, angiotensin II-dependent stimulation of local L-type Ca(2+) channel sparklet activity in isolated cells and contraction of intact arteries was abolished following inhibition of NADPH oxidase.

Conclusions: Our data support a novel model of local oxidative regulation of Ca(2+) influx where vasoconstrictors coupled to NAPDH oxidase (eg, angiotensin II) induce discrete sites of ROS generation resulting in oxidative activation of adjacent protein kinase Cα molecules that in turn promote local sites of enhanced L-type Ca(2+) channel activity, resulting in increased Ca(2+) influx and contraction.


Figures

Figure 1
Figure 1. Reactive oxygen species increase tone in pressurized cerebral arteries
A, Representative time course showing the luminal diameter of a pressurized (80 mm Hg) cerebral artery exposed to hypoxanthine (HX; 250 μmol/L) followed by xanthine oxidase (XO; 0.2mU/mL) plus HX. B, Plot of the mean ± SEM change in arterial tone (% Δ arterial tone) during HX and XO/HX exposure (n=7 arteries). C, Representative time course showing the luminal diameter of a pressurized (80 mm Hg) cerebral artery exposed to HX followed by XO/HX in the presence of the L-type Ca2+ channel blocker diltiazem (10 μmol/L). D, Plot of the mean ± SEM change in arterial tone (% Δ arterial tone) during diltiazem + HX and diltiazem + XO/HX exposure (n=3 arteries). *P<0.05
Figure 2
Figure 2. Reactive oxygen species increase L-type Ca2+ channel sparklet activity in isolated cerebral arterial smooth muscle cells
A, Representative TIRF images showing Ca2+ influx in an arterial myocyte before and after application of XO and HX (2mU/mL and 250 μmol/L, respectively). Traces show the time course of Ca2+ influx at the three circled sites before and after XO/HX. B, Ca2+ sparklet amplitude histograms before (white) and after XO/HX exposure (red). The solid black lines are best-fits to the control (q=34 nmol/L) and to the XO/HX (q=36 nmol/L) histograms with a multi-component Gaussian function where q is the quantal unit of Ca2+ influx (see Detailed Methods in the Online Supplement). C, Plot of Ca2+ sparklet site activities (nPs) before and after XO/HX (n=8 cells). The red solid lines are the arithmetic means of each group and the dashed line marks the threshold for high-activity Ca2+ sparklet sites (nPs≥0.2). D, Plot of the mean ± SEM Ca2+ sparklet density (Ca2+ sparklet sites/μm2) before and after XO/HX (n=8 cells). *P<0.05
Figure 3
Figure 3. Reactive oxygen species increase L-type Ca2+ channel sparklet activity via stimulation of PKC
A, Representative surface plots of PKCα-associated immunofluorescence in cerebral arterial myocytes exposed to either HX alone (250 μmol/L) or XO and HX (2 mU/mL and 250 μmol/L, respectively). B, Bar plot of the mean ± SEM membrane-to-cytosol PKCα-associated fluorescence ratios in HX- and XO/HX-exposed myocytes (n=15 cells from three independent experiments). C, Representative TIRF images showing Ca2+ influx in an arterial myocyte under control conditions and after exposure to XO and HX (2 mU/mL and 250 μmol/L, respectively) in the presence of the PKC inhibitor Gö6976 (100 nmol/L). D, Plot of Ca2+ sparklet site activities (nPs) and mean ± SEM Ca2+ sparklet density (Ca2+ sparklet sites/μm2) under control conditions and after exposure to XO and HX in the presence of Gö6976 (n=5 cells). *P<0.05
Figure 4
Figure 4. Inhibition of NADPH oxidase with apocynin prevents angiotensin II-dependent stimulation of L-type Ca2+ channel sparklet activity
A, Representative TIRF images showing Ca2+ influx in an arterial myocyte before and after application of angiotensin II (Ang II; 100 nmol/L). Traces show the time course of Ca2+ influx at the three circled sites. B, Plot of Ca2+ sparklet site activities (nPs) and plot of mean ± SEM Ca2+ sparklet density (Ca2+ sparklet sites/μm2) before and after Ang II (n=8 cells). C, Representative TIRF images show Ca2+ influx in an arterial myocyte before and after application of Ang II (100 nmol/L) in the presence of the NADPH oxidase inhibitor apocynin (25 μmol/L). Traces showing the time course of Ca2+ influx at the three circled sites. D, Plot of Ca2+ sparklet site activities (nPs) and plot of mean ± SEM Ca2+ sparklet density (Ca2+ sparklet sites/μm2) before after Ang II in the presence of apocynin (n=6 cells). *P<0.05
Figure 5
Figure 5. Inhibition of NADPH oxidase and PKC prevents angiotensin II-dependent constriction of cerebral arteries
A, B, & C, Representative time courses showing luminal diameters of pressurized (80 mm Hg) cerebral arteries exposed to angiotensin II (Ang II; 1 nmol/L) in the absence (panel A) or presence of the NADPH oxidase inhibitor apocynin (25 μmol/L; panel B) and the PKC inhibitor Gö6976 (100 nmol/L; panel C). D, Plot of the mean ± SEM induced constriction (%) by Ang II in the absence or presence of apocynin and Gö6976 (n=3 arteries). *P<0.05
Figure 6
Figure 6. Angiotensin II promotes spatially restricted generation of reactive oxygen species in isolated cerebral arterial smooth muscle cells
A, Representative TIRF images showing punctate elevations of dichlorofluorescein (DCF) fluorescence (indicating reactive oxygen species formation) in an arterial myocyte before and after application of Ang II (100 nmol/L). B, Plot of the mean ± SEM reactive oxygen species (ROS) puncta density (ROS puncta/μm2) before and after Ang II (n=6 cells). C, Plot of the mean ± SEM ROS puncta amplitude (arbitrary units; AU) before and after Ang II (n=6 cells). *P<0.05
Figure 7
Figure 7. Local sites of elevated reactive oxygen species generation precede and colocalize with Ca2+ sparklet activity in cerebral arterial smooth muscle cells
A, Representative TIRF images of an arterial myocyte exposed to Ang II showing sequential DCF fluorescence (indicating ROS formation; panel 1) and fluo-5F fluorescence (indicating Ca2+ influx; panel 2). DCF fluorescence was obtained in Ca2+-free solution prior to cell rupture and dialysis with fluo-5F and subsequent introduction of Ca2+ (20 mmol/L). Panel 4 shows an overlay of fluo-5F fluorescence thresholded to isolate Ca2+ sparklet activity (red; panel 3) with the DCF fluorescence (green; panel 1) to demonstrate colocalization (yellow) of punctate ROS generation and Ca2+ sparklet activity. Traces showing the time course of DCF fluorescence (i.e. ROS generation) at the site circled in panel 1 (i) and the time course of fluo-5F fluorescence (i.e. Ca2+ influx) at the site circled in panel 2 (ii). B, Plot of the mean ± SEM distance (in μm) between the peaks of ROS puncta and adjacent Ca2+ sparklet sites (n=6 ROS/Ca2+ sparklet sites from 5 cells). C, plot of the mean ± SEM cell area imaged (in μm2) during the DCF/fluo-5F experiments (n=5 cells). D, Proposed mechanism by which local generation of ROS stimulate PKC-dependent L-type Ca2+ channel sparklet activity in cerebral arterial smooth muscle cells (see Discussion).

References

    1. Adiga IK, Nair RR. Multiple signaling pathways coordinately mediate reactive oxygen species dependent cardiomyocyte hypertrophy. Cell Biochem Funct. 2008;26:346–351. - PubMed
    1. Allen CL, Bayraktutan U. Oxidative stress and its role in the pathogenesis of ischaemic stroke. Int J Stroke. 2009;4:461–470. - PubMed
    1. Hordijk PL. Regulation of NADPH oxidases: The role of Rac proteins. Circ Res. 2006;98:453–462. - PubMed
    1. Lee MY, Griendling KK. Redox signaling, vascular function, and hypertension. Antioxid Redox Signal. 2008;10:1045–1059. - PMC - PubMed
    1. Paravicini TM, Touyz RM. NADPH oxidases, reactive oxygen species, and hypertension: Clinical implications and therapeutic possibilities. Diabetes Care. 2008;31 (Suppl 2):S170–180. - PubMed

MeSH terms