

Simulation of single-molecule trapping in a nanochannel
- PMID: 20799801
- PMCID: PMC2929258
- DOI: 10.1117/1.3477320
Simulation of single-molecule trapping in a nanochannel
Abstract
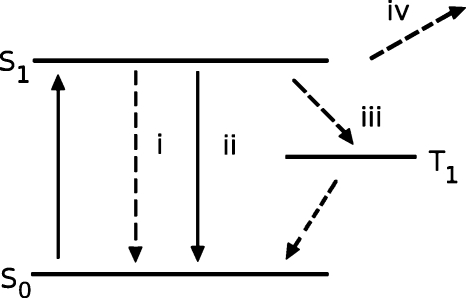
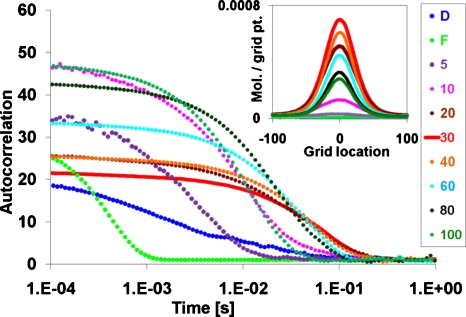
The detection and trapping of single fluorescent molecules in solution within a nanochannel is studied using numerical simulations. As optical forces are insufficient for trapping molecules much smaller than the optical wavelength, a means for sensing a molecule's position along the nanochannel and adjusting electrokinetic motion to compensate diffusion is assessed. Fluorescence excitation is provided by two adjacently focused laser beams containing temporally interleaved laser pulses. Photon detection is time-gated, and the displacement of the molecule from the middle of the two foci alters the count rates collected in the two detection channels. An algorithm for feedback control of the electrokinetic motion in response to the timing of photons, to reposition the molecule back toward the middle for trapping and to rapidly reload the trap after a molecule photobleaches or escapes, is evaluated. While accommodating the limited electrokinetic speed and the finite latency of feedback imposed by experimental hardware, the algorithm is shown to be effective for trapping fast-diffusing single-chromophore molecules within a micron-sized confocal region. Studies show that there is an optimum laser power for which loss of molecules from the trap due to either photobleaching or shot-noise fluctuations is minimized.
Figures


Similar articles
-
Conformation, length, and speed measurements of electrodynamically stretched DNA in nanochannels.Biophys J. 2008 Jul;95(1):273-86. doi: 10.1529/biophysj.107.121020. Epub 2008 Mar 13. Biophys J. 2008. PMID: 18339746 Free PMC article.
-
Coupled laser molecular trapping, cluster assembly, and deposition fed by laser-induced Marangoni convection.Opt Express. 2008 Apr 14;16(8):5673-80. doi: 10.1364/oe.16.005673. Opt Express. 2008. PMID: 18542674
-
Optical traps induce fluorophore photobleaching by two-photon excitation.Biophys J. 2023 Nov 21;122(22):4316-4325. doi: 10.1016/j.bpj.2023.10.006. Epub 2023 Oct 12. Biophys J. 2023. PMID: 37828742 Free PMC article.
-
Optical tweezers for the micromanipulation of plant cytoplasm and organelles.Curr Opin Plant Biol. 2010 Dec;13(6):731-5. doi: 10.1016/j.pbi.2010.10.004. Epub 2010 Nov 17. Curr Opin Plant Biol. 2010. PMID: 21093352 Review.
-
Forces of a single-beam gradient laser trap on a dielectric sphere in the ray optics regime.Methods Cell Biol. 1998;55:1-27. doi: 10.1016/s0091-679x(08)60399-4. Methods Cell Biol. 1998. PMID: 9352508 Review.
References
-
- Enderlein J., “Tracking of fluorescent molecules diffusing within membranes,” Appl. Phys. B APDOEM 71, 773–777 (2000).10.1007/s003400000409 - DOI
-
- Lessard G. A., Goodwin P. M., and Werner J. H., “Three-dimensional tracking of individual quantum dots,” Appl. Phys. Lett. APPLAB 91, 224106 (2007).10.1063/1.2819074 - DOI
Publication types
MeSH terms
Substances
Grants and funding
LinkOut - more resources
Full Text Sources
Research Materials
