. 2010 Jul-Aug;15(4):046007.
doi: 10.1117/1.3463010.

Principal component model of multispectral data for near real-time skin chromophore mapping

Affiliations

Principal component model of multispectral data for near real-time skin chromophore mapping

Jana M Kainerstorfer et al. J Biomed Opt. 2010 Jul-Aug.

Abstract

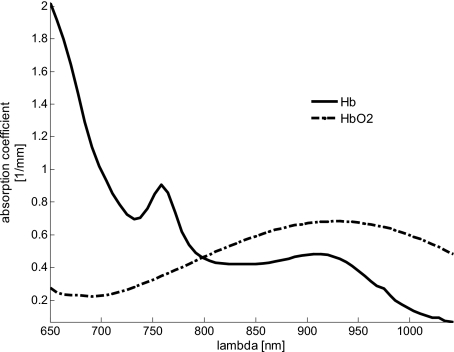
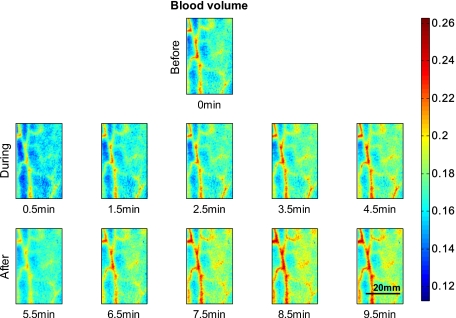
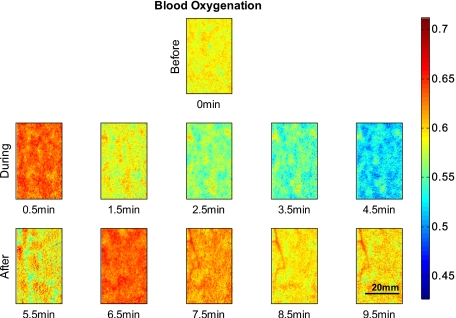
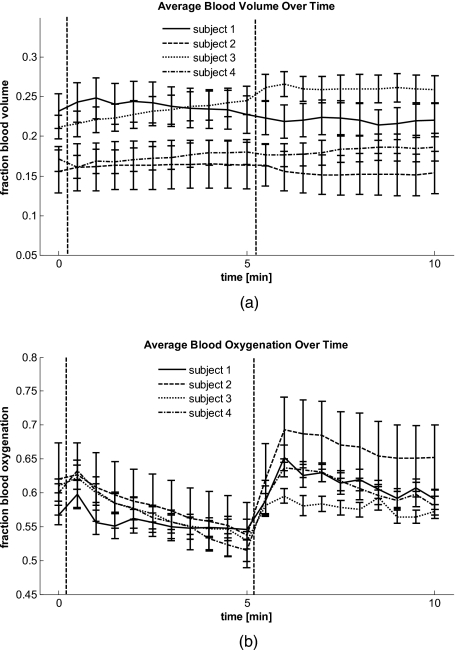
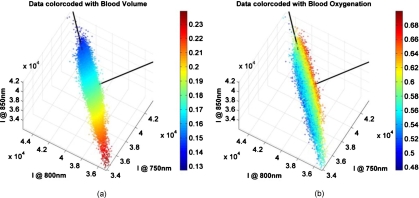
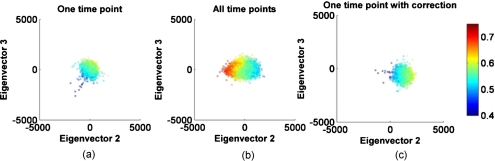
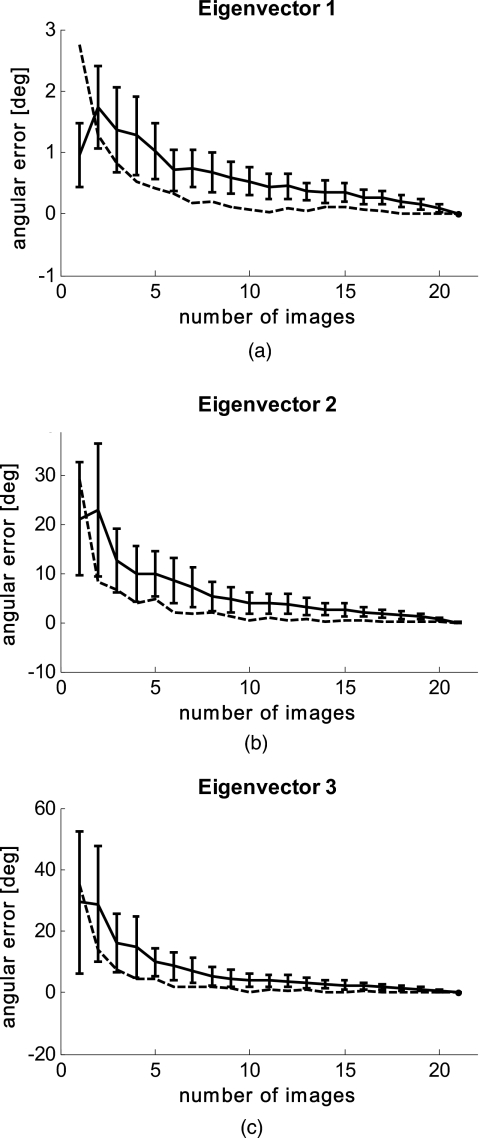
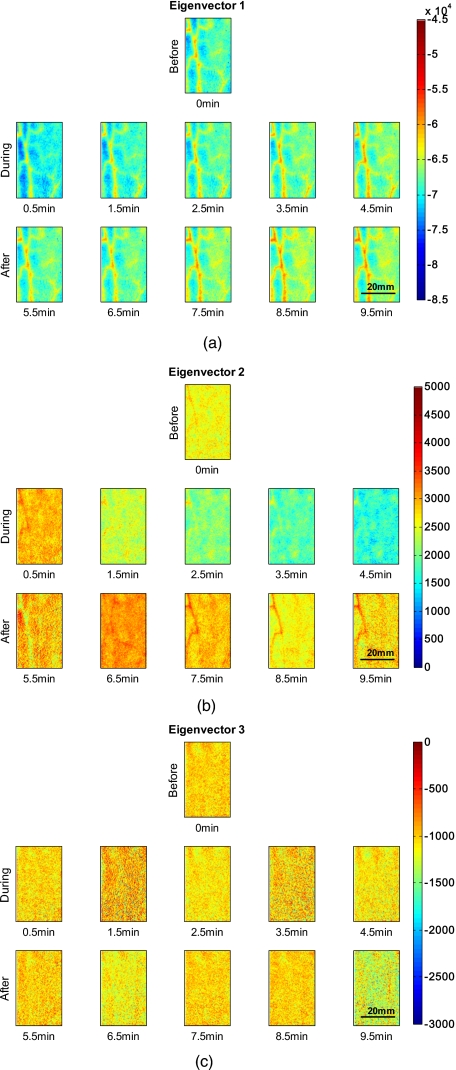
Multispectral images of skin contain information on the spatial distribution of biological chromophores, such as blood and melanin. From this, parameters such as blood volume and blood oxygenation can be retrieved using reconstruction algorithms. Most such approaches use some form of pixelwise or volumetric reconstruction code. We explore the use of principal component analysis (PCA) of multispectral images to access blood volume and blood oxygenation in near real time. We present data from healthy volunteers under arterial occlusion of the forearm, experiencing ischemia and reactive hyperemia. Using a two-layered analytical skin model, we show reconstruction results of blood volume and oxygenation and compare it to the results obtained from our new spectral analysis based on PCA. We demonstrate that PCA applied to multispectral images gives near equivalent results for skin chromophore mapping and quantification with the advantage of being three orders of magnitude faster than the reconstruction algorithm.


Figures

Figure 1
Figure 1
Absorption spectra of deoxygenated (Hb) and oxygenated (HbO2) blood with the isosbestic point of blood at 800 nm. For 750 and 850 nm, the absorption coefficients for oxygenated and deoxygenated blood are well separable.
Figure 2
Figure 2
Fractional blood volume concentrations over time. The first row shows the reconstructed blood volume map over several centimeters of a lower forearm before occlusion. The second row shows blood volume of the same area of the arm during occlusion, and the third row shows results after release of pressure. Veins are clearly distinguishable due to the increase in blood compared to surrounding tissue.
Figure 3
Figure 3
Fractional blood oxygenation over time of the same area as shown in Fig. 1. The second row shows blood oxygenation during occlusion and the expected ischemic behavior, which is a decrease in oxygenated blood. The third row shows the expected hyperemic behavior, which is an overshoot of oxygenation.
Figure 4
Figure 4
(a) Average blood volume and (b) Blood oxygenation over time for four subjects. The dashed lines indicate start and end of occlusion.
Figure 5
Figure 5
3-D scatterplots of wavelength specific intensity data color coded with (a) blood volume and (b) blood oxygenation. The black lines indicate the eigenaxes found by PCA. Eigenvector 1 is aligned with blood volume, and eigenvector 2 with blood oxygenation. (Color online only.)
Figure 6
Figure 6
Transformed data after PCA in the eigenvectors 2 and 3 plane, color coded with the corresponding blood oxygenation results. (a) shows PCA performed on one time point, (b) over the data including all time points, and (c) shows the transformed data of one time point using the set of eigenvectors obtained in (b). (Color online only.)
Figure 7
Figure 7
Validity of image summation for PCA. Solid lines are the average distance from local ensemble plus their standard deviation. Dashed lines are the distance of local ensemble average from “truth” (21 image ensemble). (a) shows data from eigenvector 1; (b) from eigenvector 2; and (c) from eigenvector 3.
Figure 8
Figure 8
Eigenvectors obtained by PCA over time for one subject. (a) shows the first eigenvector, which corresponds to blood volume; (b) shows the second eigenvector, which corresponds to blood oxygenation; and (c) shows the third eigenvector.
Figure 9
Figure 9
Average eigenvectors over time for four subjects. The dashed lines indicate start and end of occlusion. (a) shows eigenvector 1, (b) eigenvector 2, and (c) eigenvector 3.
Figure 10
Figure 10
(a) Blood volume versus eigenvector 1 and (b) blood oxygenation versus eigenvector 2.

Similar articles

Cited by

References

    1. Jacques S. L., Ramella-Roman J. C., and Lee K., “Imaging skin pathology with polarized light,” J. Biomed. Opt. JBOPFO 7(3), 329–340 (2002).10.1117/1.1484498 - DOI - PubMed
    1. Mantis G. and Zonios G., “Simple two-layer reflectance model for biological tissue applications,” Appl. Opt. APOPAI 48(18), 3490–3496 (2009).10.1364/AO.48.003490 - DOI - PubMed
    1. Miyamae Y., Yamakawa Y., Kawabata M., and Ozaki Y., “A noninvasive method for assessing interior skin damage caused by chronological aging and photoaging based on near-infrared diffuse reflection spectroscopy,” Appl. Spectrosc. APSPA4 62(6), 677–681 (2008).10.1366/000370208784658156 - DOI - PubMed
    1. Tseng S. H., Bargo P., Durkin A., and Kollias N., “Chromophore concentrations, absorption and scattering properties of human skin in-vivo,” Opt. Express OPEXFF 17(17), 14599–14617 (2009).10.1364/OE.17.014599 - DOI - PMC - PubMed
    1. Vogel A., Chernomordik V. V., Riley J. D., Hassan M., Amyot F., Dasgeb B., Demos S. G., Pursley R., Little R. F., Yarchoan R., Tao Y., and Gandjbakhche A. H., “Using noninvasive multispectral imaging to quantitatively assess tissue vasculature,” J. Biomed. Opt. JBOPFO 12(5), 051604 (2007).10.1117/1.2801718 - DOI - PMC - PubMed

Publication types