

Nondestructive assessment of the severity of occlusal caries lesions with near-infrared imaging at 1310 nm
- PMID: 20799842
- PMCID: PMC2929264
- DOI: 10.1117/1.3475959
Nondestructive assessment of the severity of occlusal caries lesions with near-infrared imaging at 1310 nm
Abstract
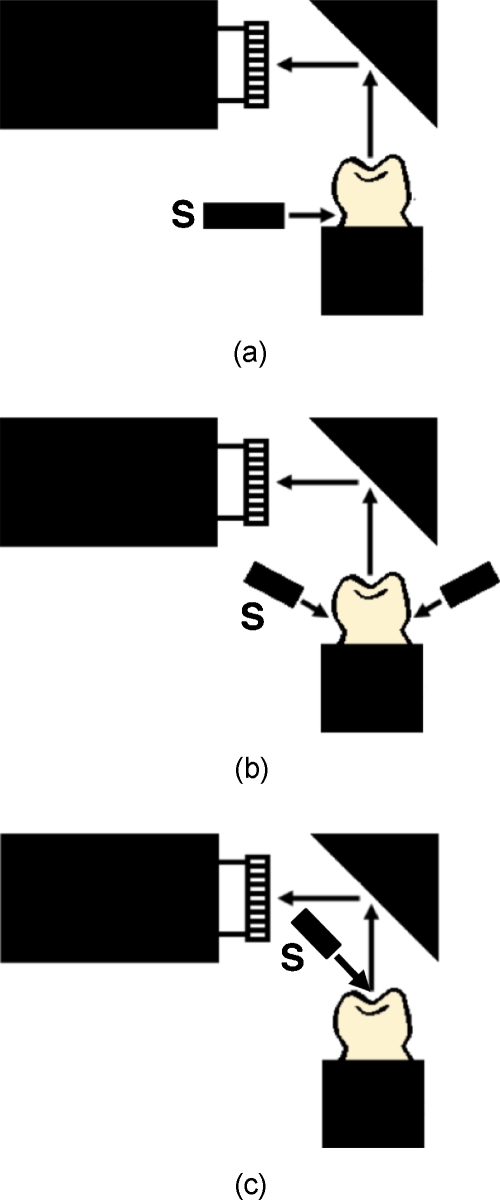
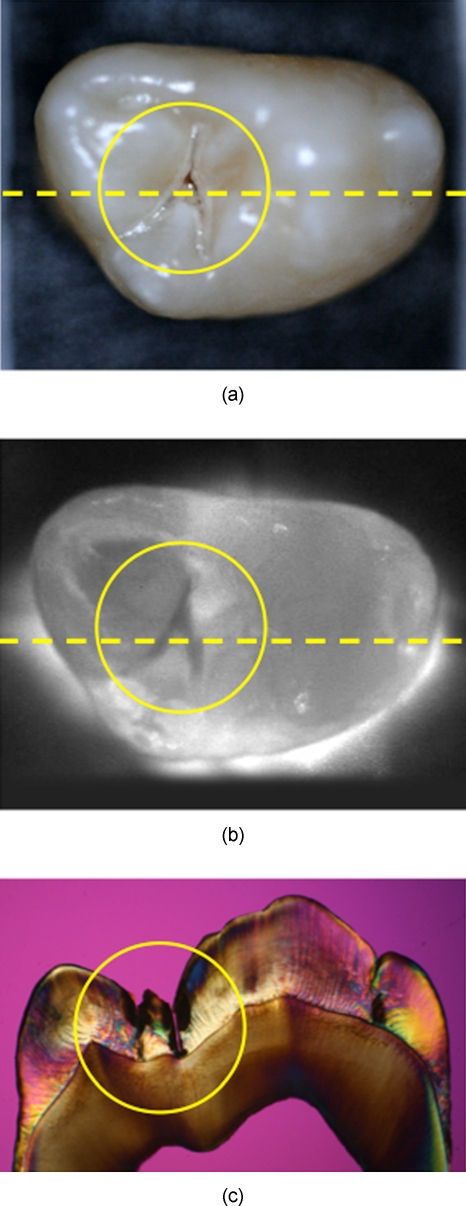
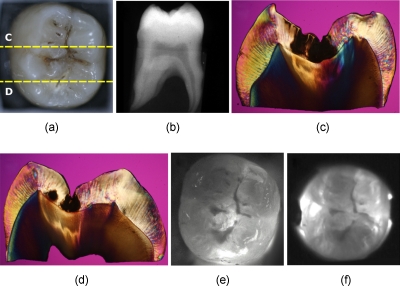
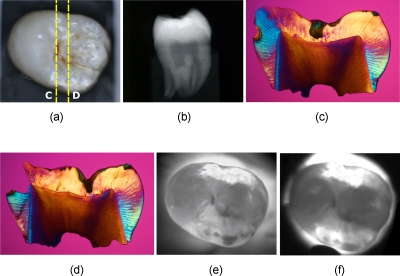
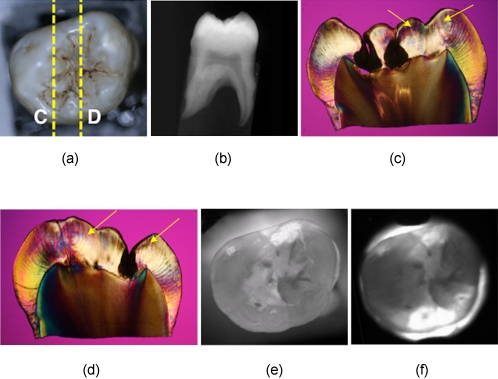
The high transparency of dental enamel in the near-infrared (NIR) at 1310 nm can be exploited for imaging dental caries without the use of ionizing radiation. The objective of this study is to determine whether the lesion contrast derived from NIR imaging in both transmission and reflectance can be used to estimate lesion severity. Two NIR imaging detector technologies are investigated: a new Ge-enhanced complementary metal-oxide-semiconductor (CMOS)-based NIR imaging camera, and an InGaAs focal plane array (FPA). Natural occlusal caries lesions are imaged with both cameras at 1310 nm, and the image contrast between sound and carious regions is calculated. After NIR imaging, teeth are sectioned and examined using polarized light microscopy (PLM) and transverse microradiography (TMR) to determine lesion severity. Lesions are then classified into four categories according to lesion severity. Lesion contrast increases significantly with lesion severity for both cameras (p<0.05). The Ge-enhanced CMOS camera equipped with the larger array and smaller pixels yields higher contrast values compared with the smaller InGaAs FPA (p<0.01). Results demonstrate that NIR lesion contrast can be used to estimate lesion severity.
Figures
Similar articles
-
In vitro near-infrared imaging of occlusal dental caries using germanium enhanced CMOS camera.Proc SPIE Int Soc Opt Eng. 2010 Mar 1;7549:75490K. doi: 10.1117/12.849338. Proc SPIE Int Soc Opt Eng. 2010. PMID: 22162916 Free PMC article.
-
Non-destructive clinical assessment of occlusal caries lesions using near-IR imaging methods.Lasers Surg Med. 2011 Dec;43(10):951-9. doi: 10.1002/lsm.21139. Epub 2011 Nov 22. Lasers Surg Med. 2011. PMID: 22109697 Free PMC article.
-
Near-infrared imaging of secondary caries lesions around composite restorations at wavelengths from 1300-1700-nm.Dent Mater. 2016 Apr;32(4):587-95. doi: 10.1016/j.dental.2016.01.008. Epub 2016 Feb 11. Dent Mater. 2016. PMID: 26876234 Free PMC article.
-
Early caries imaging and monitoring with near-infrared light.Dent Clin North Am. 2005 Oct;49(4):771-93, vi. doi: 10.1016/j.cden.2005.05.008. Dent Clin North Am. 2005. PMID: 16150316 Review.
-
Dynamics of and diagnostic methods for detecting small carious lesions.Caries Res. 1996;30(6):381-8. doi: 10.1159/000262348. Caries Res. 1996. PMID: 8946093 Review.
Cited by
-
Compact in vivo handheld dual SWIR transillumination/reflectance imaging system for the detection of proximal and occlusal lesions.Proc SPIE Int Soc Opt Eng. 2021 Mar;11627:116270N. doi: 10.1117/12.2584903. Epub 2021 Mar 5. Proc SPIE Int Soc Opt Eng. 2021. PMID: 33790493 Free PMC article.
-
Dual short wavelength infrared transillumination/reflectance mode imaging for caries detection.J Biomed Opt. 2021 Jan;26(4):043004. doi: 10.1117/1.JBO.26.4.043004. J Biomed Opt. 2021. PMID: 33515220 Free PMC article.
-
Transillumination and optical coherence tomography for the detection and diagnosis of enamel caries.Cochrane Database Syst Rev. 2021 Jan 27;1(1):CD013855. doi: 10.1002/14651858.CD013855. Cochrane Database Syst Rev. 2021. PMID: 33502759 Free PMC article.
-
Comparative Diagnostic Accuracy of VistaCam IX Proxi and Bitewing Radiography for Detection of Interproximal Caries.J Dent (Shiraz). 2023 Dec 1;24(4):395-403. doi: 10.30476/dentjods.2022.95326.1860. eCollection 2023 Dec. J Dent (Shiraz). 2023. PMID: 38149228 Free PMC article.
-
Recent Advances in the Diagnosis of Enamel Cracks: A Narrative Review.Diagnostics (Basel). 2022 Aug 22;12(8):2027. doi: 10.3390/diagnostics12082027. Diagnostics (Basel). 2022. PMID: 36010379 Free PMC article. Review.
References
-
- Pine C. M., “Fiber-optic transillumination (FOTI) in caries diagnosis,” Early Detection Dental Caries, pp. 51–66 (1996).
-
- Peltola J. and Wolf J., “Fiber optics transillumination in caries diagnosis,” Proc. Finn Dent. Soc. ZZZZZZ 77, 240–244 (1981). - PubMed
-
- Holt R. D. and Azeevedo M. R., “Fiber Optic transillumination and radiographs in diagnosis of approximal caries in primary teeth,” Community Dent. Health ZZZZZZ 6, 239–247 (1989). - PubMed
Publication types
MeSH terms
Grants and funding
LinkOut - more resources
Full Text Sources
Other Literature Sources
Medical
Miscellaneous
