Comparative Study
. 2010 Nov 15;249(1):65-75.
doi: 10.1016/j.taap.2010.08.018. Epub 2010 Aug 26.

An analysis of the effects of Mn2+ on oxidative phosphorylation in liver, brain, and heart mitochondria using state 3 oxidation rate assays

Affiliations
Comparative Study

An analysis of the effects of Mn2+ on oxidative phosphorylation in liver, brain, and heart mitochondria using state 3 oxidation rate assays

Thomas E Gunter et al. Toxicol Appl Pharmacol. .

Abstract

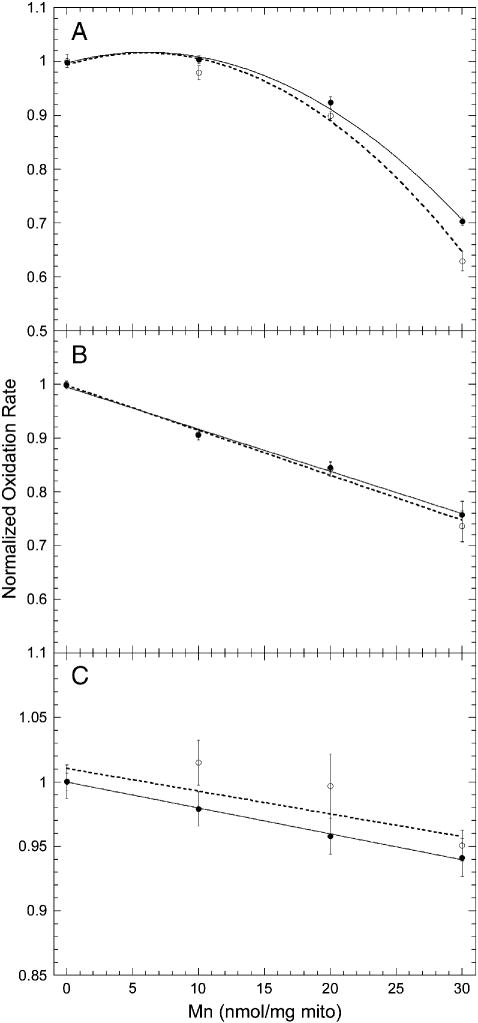
Manganese (Mn) toxicity is partially mediated by reduced ATP production. We have used oxidation rate assays--a measure of ATP production--under rapid phosphorylation conditions to explore sites of Mn(2+) inhibition of ATP production in isolated liver, brain, and heart mitochondria. This approach has several advantages. First, the target tissue for Mn toxicity in the basal ganglia is energetically active and should be studied under rapid phosphorylation conditions. Second, Mn may inhibit metabolic steps which do not affect ATP production rate. This approach allows identification of inhibitions that decrease this rate. Third, mitochondria from different tissues contain different amounts of the components of the metabolic pathways potentially resulting in different patterns of ATP inhibition. Our results indicate that Mn(2+) inhibits ATP production with very different patterns in liver, brain, and heart mitochondria. The primary Mn(2+) inhibition site in liver and heart mitochondria, but not in brain mitochondria, is the F₁F₀ ATP synthase. In mitochondria fueled by either succinate or glutamate+malate, ATP production is much more strongly inhibited in brain than in liver or heart mitochondria; moreover, Mn(2+) inhibits two independent sites in brain mitochondria. The primary site of Mn-induced inhibition of ATP production in brain mitochondria when succinate is substrate is either fumarase or complex II, while the likely site of the primary inhibition when glutamate plus malate are the substrates is either the glutamate/aspartate exchanger or aspartate aminotransferase.


Conflict of interest statement

CONFLICT OF INTEREST The authors certify that there is no conflict of interest involved with the work reported here.

Figures

Fig. 1
Fig. 1. Portions of the intramitochondrial metabolic pathways utilized in the current experiments
Top - The electron transport chain, the F1F0 ATP synthase, transporters and aspartate aminotransferase. Bottom - The tricarboxylic acid (TCA) cycle.
Fig. 2
Fig. 2. NADH production by αKGDH
A. NADH production by αKGDH as a function of the [Ca2+] of the medium. No error bars are given since this is a single set of data points. B. If the above experiment is stopped at a [Ca2+] of 2 μM, and Mn2+ added as indicated, the production of NADH decreases with [Mn2+] as shown. The points are averages of 3 sets of data and the error bars represent plus and minus one standard error of the mean.
Fig. 3
Fig. 3. Oxidation rate as a function of substrate concentration in liver mitochondria
The oxidation rate of isolated liver mitochondria in the presence of 1 mM ADP and 5 mM inorganic phosphate (Pi) as a function of succinate concentration (●). Rotenone (5 μM) was in the samples when succinate was the substrate. A similar plot of oxidation rate as a function of glutamate concentration in the presence of the same concentrations of ADP and Pi, and a malate concentration 0.5 mM greater than the glutamate concentration (■) except at zero glutamate where the malate concentration was also zero. The error bars show one standard error of the mean for three measurements. This data led to the selection of 6 mM succinate and 6 mM glutamate plus 5 mM malate as “saturation concentrations” of substrate for subsequent oxidation rate experiments using liver mitochondria.
Fig. 4
Fig. 4. Normalized oxidation rates as a function of Mn2+ concentration in liver mitochondria
Normalized oxidation rates for both coupled(●) and uncoupled (○) liver mitochondria as a function of Mn2+ concentration using A. succinate or B. glu + mal as substrate. The data points show the averages and standard errors of the mean for 3 separate measurements each using 3 independent mitochondrial preparations (9 points for each data point). The rates were normalized to the average rate at 0 Mn2+ addition. As described in Materials and Methods, the coupled mitochondria were added to medium containing A. succinate (6 mM) and inorganic phosphate (5 mM) or B. glutamate (6 mM) plus malate (5 mM) plus inorganic phosphate (5 mM). They were incubated with Mn2+ as described in Materials and Methods. Aliquots of incubated mitochondria were added to the oxidation chamber and 1 mM ADP was added through the capillary in the top of the oxidation chamber to initiate state 3 oxidation and ATP production. Uncoupled rates were measured similarly except that the uncoupler DNP was added just before measurement of the oxidation rate. The oxidation rate measurements themselves took 20 to 30 seconds. The lines shown represent lines of least squares fit to the data.
Fig. 5
Fig. 5. Normalized oxidation rates as a function of Mn2+ concentration in brain mitochondria
Normalized oxidation rates for coupled (●) and uncoupled (○) rat brain mitochondria as a function of Mn2+ concentration using A. succinate (15 mM), B. glutamate (10 mM) plus malate (5 mM), and C. pyruvate (5 mM) plus malate (5 mM) as substrates. 5 mM inorganic phosphate was used in each case. The measurements were carried out similarly to those described in Fig. 4 except that the mitochondria were isolated from rat brain and the smaller oxidation chamber was used. Uncoupled rates were measured similarly except that the uncoupler CCCP was added just before measurement of the oxidation rate. As in Fig. 4, the data points represent an average of three independent measurements for each of three separate preparations of brain mitochondria representing 9 points total for each point plotted. The lines fitted through the data points for the glu + mal and pyr + mal data are least squares fits, while the curves through the succinate data are fitted to a polynomial. The error bars represent one standard error of the mean.
Fig. 6
Fig. 6. Normalized oxidation rates as a function of Mn2+ concentration in heart mitochondria
Normalized oxidation rates for coupled (●) and uncoupled (○) rat heart mitochondria as a function of Mn2+ concentration using A. succinate (15 mM), B. glutamate (10 mM) plus malate (5 mM), and C. pyruvate (5 mM) plus malate (5 mM) as substrates. 5 mM inorganic phosphate was used in each case. The measurements were carried out similarly to those in Fig. 4 except that the mitochondria were isolated from rat heart and the smaller oxidation chamber was used. Uncoupled rates were measured similarly except that the uncoupler CCCP was added just before measurement of the oxidation rate. As in Fig. 4, the data points represent an average of three independent measurements for each of three separate preparations of heart mitochondria representing 9 points total for each data point plotted. The straight lines fitted to the uncoupled data represent least squares fitted lines, while the curved lines through the coupled data are exponential decay curves fitted to the data. Error bars represent plus or minus one standard error of the mean.

References

    1. Aschner M, Erikson KM, Herrero Hernandez E, Tjalkens R. Manganese and its role in Parkinson’s disease: from transport to neuropathology. Neuromolecular Medicine. 2009;11:252–266. - PMC - PubMed
    1. Aschner M, Guilarte TR, Schneider JS, Zheng W. Manganese: Recent advances in understanding its transport and neurotoxicity. Toxicol and Appl Pharmacol. 2007;221:131–147. - PMC - PubMed
    1. Au C, Benedetto A, Aschner M. Manganese transport in eukaryotes: The role of DMT1. Neurotox. 2008;29:569–576. - PMC - PubMed
    1. Ayotte P, Plaa L. Hepatic subcellular distribution of manganese in manganese and manganese-bilirubin induced cholestasis. Biochem Pharm. 1985;34:3857–3865. - PubMed
    1. Balaban RS. Cardiac energy metabolism homeostasis: Role of cytosolic calcium. J Mol Cell Cardiol. 2002;34:11259–11271. - PubMed

Publication types

MeSH terms

LinkOut - more resources