. 2010 Nov 3;28(47):7542-50.
doi: 10.1016/j.vaccine.2010.08.061. Epub 2010 Aug 26.

The efficacy of pneumococcal capsular polysaccharide-specific antibodies to serotype 3 Streptococcus pneumoniae requires macrophages

Affiliations

The efficacy of pneumococcal capsular polysaccharide-specific antibodies to serotype 3 Streptococcus pneumoniae requires macrophages

Kevin Fabrizio et al. Vaccine. .

Abstract

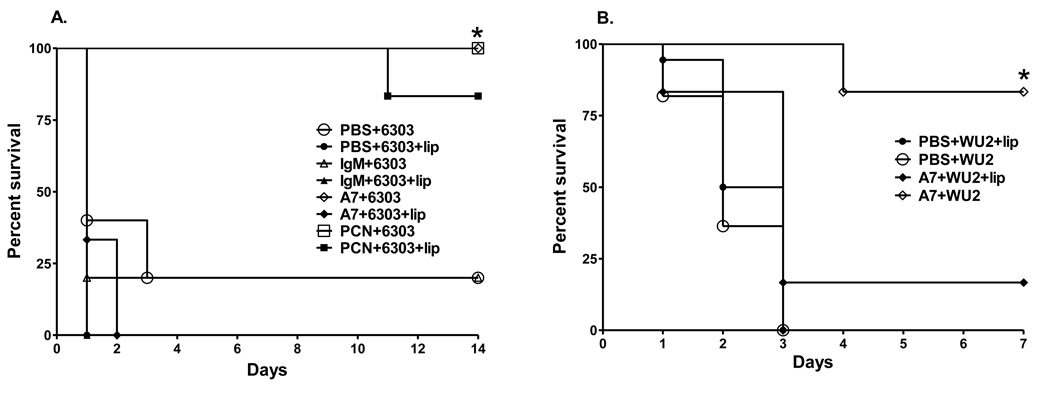
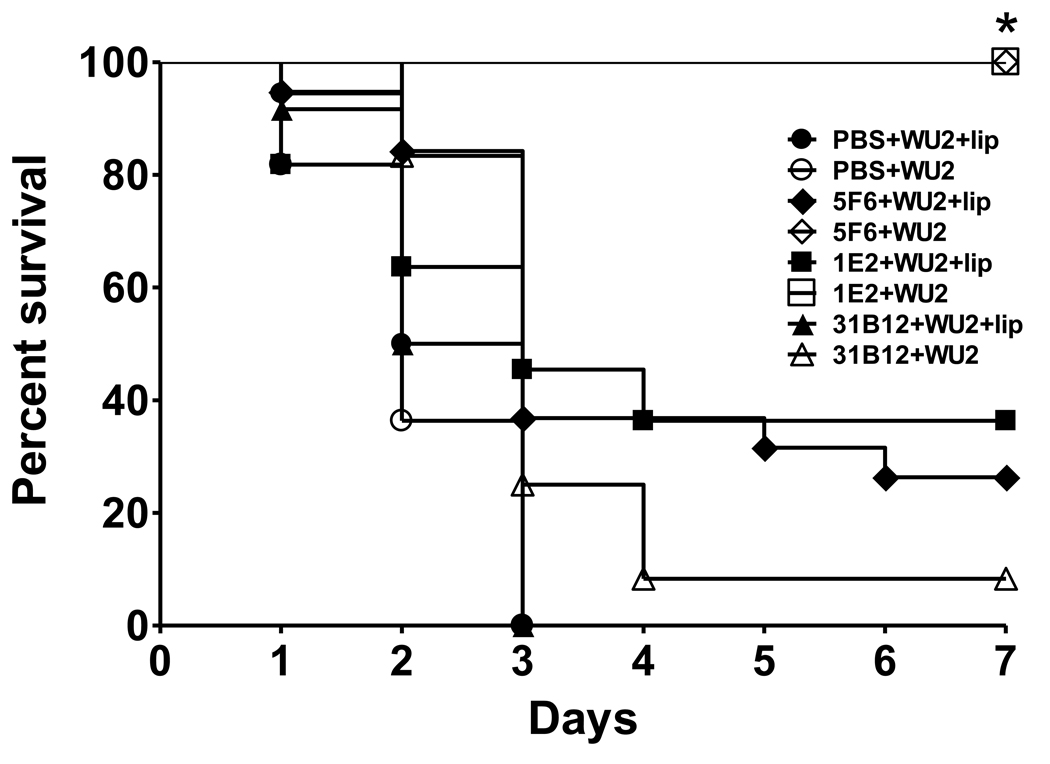
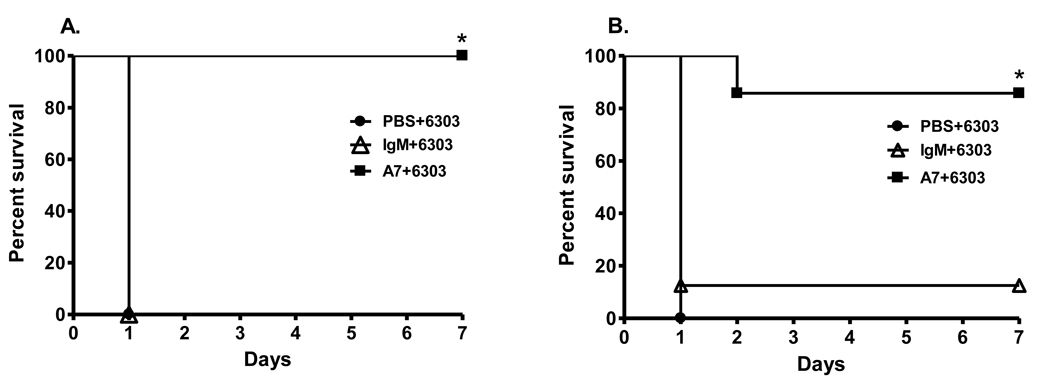
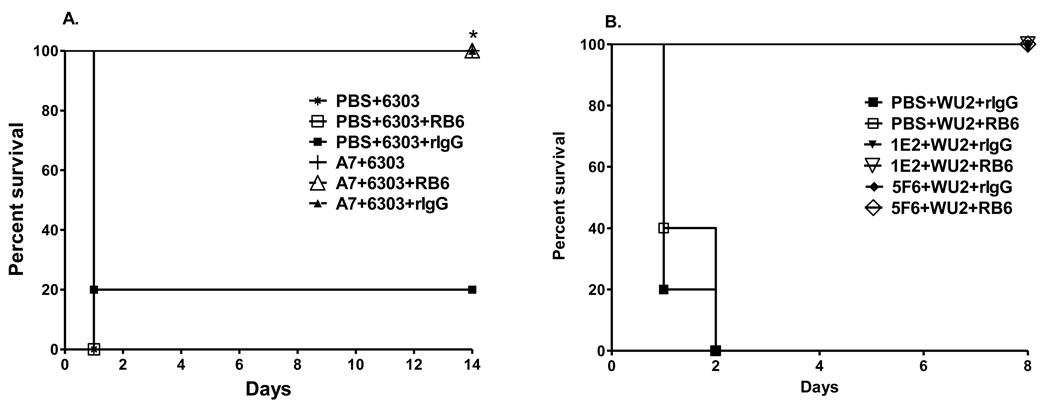
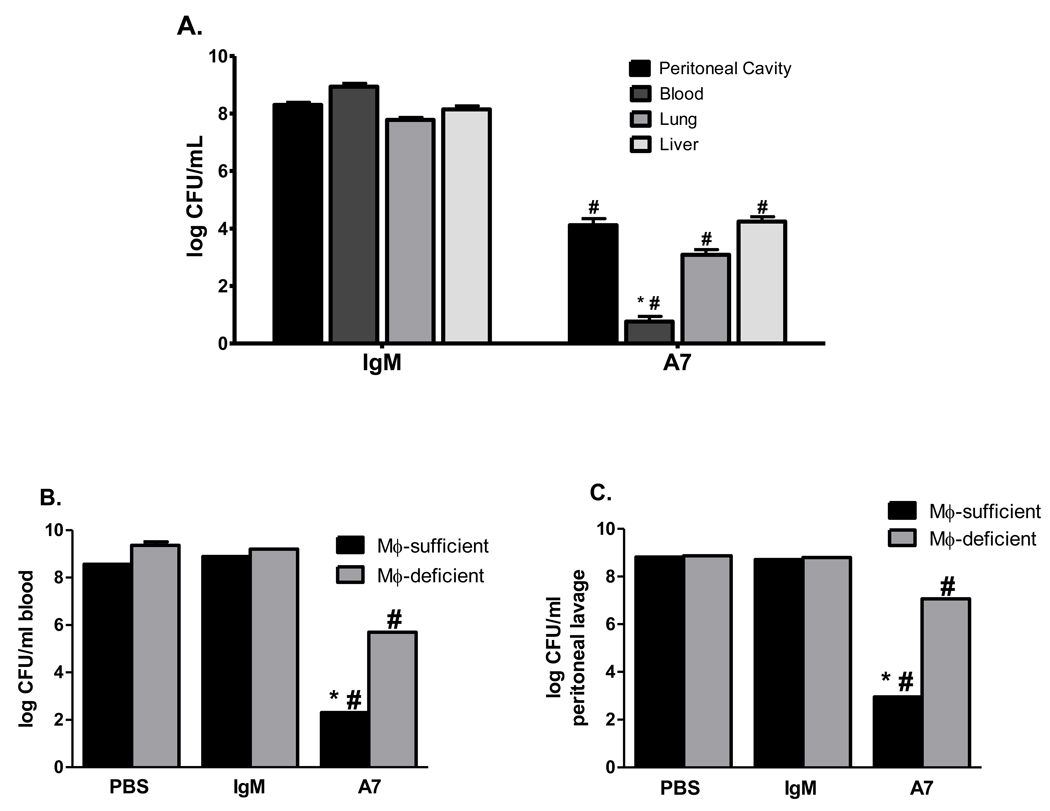
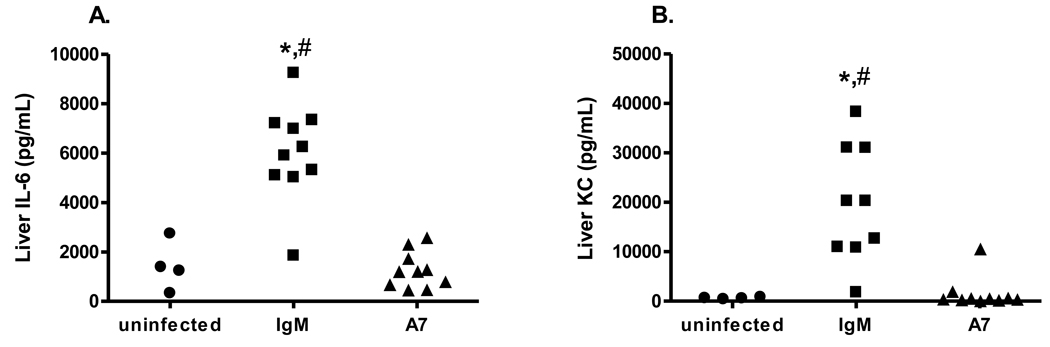
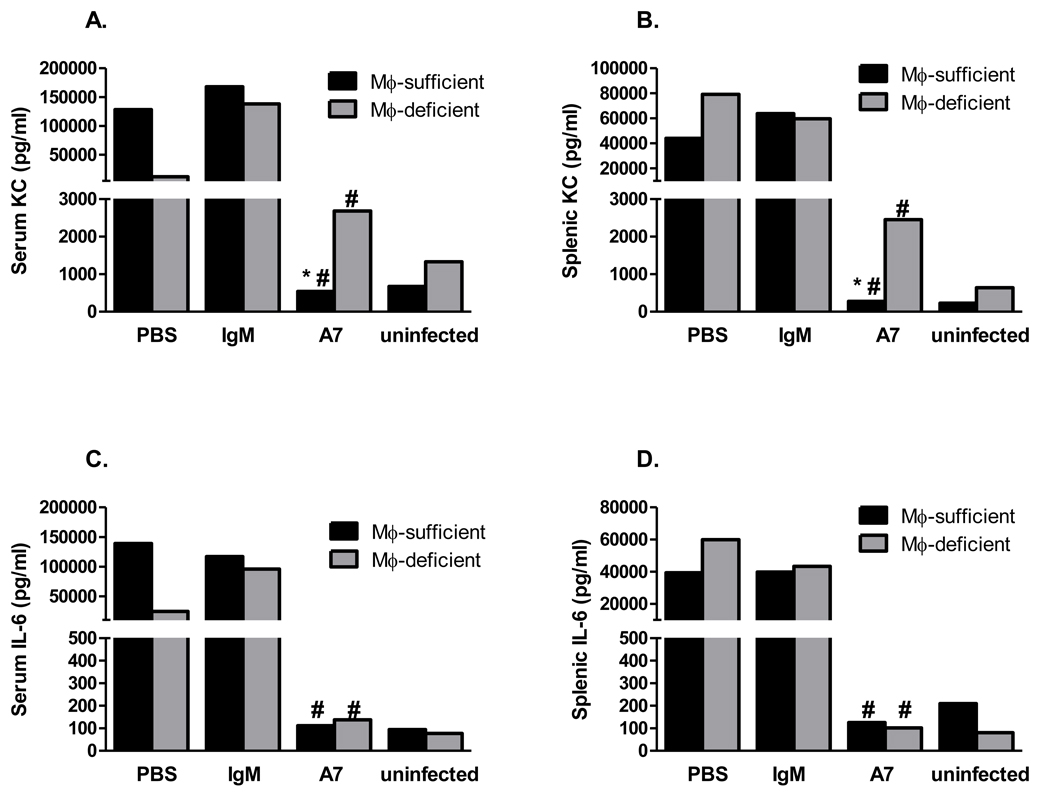
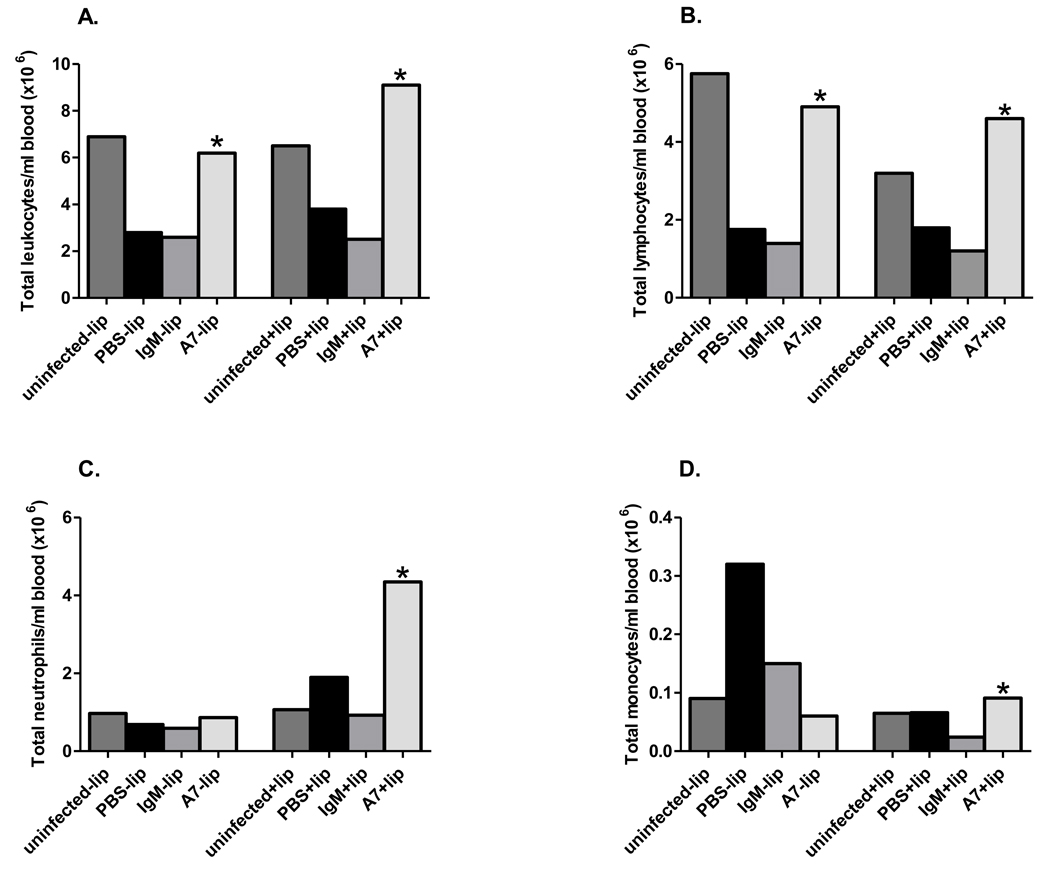
The efficacy of antibody immunity against Streptococcus pneumoniae stems from the ability of opsonic, serotype (ST)-specific antibodies to pneumococcal capsular polysaccharide (PPS) to facilitate killing of the homologous ST by host phagocytes. However, PPS-specific antibodies have been identified that are protective in mice, but do not promote opsonic killing in vitro, raising the question of how they mediate protection in vivo. To probe this question, we investigated the dependence of antibody efficacy against lethal systemic (intraperitoneal, i.p.) infection with Streptococcus pneumoniae serotype 3 (ST3) on macrophages and neutrophils for the following PPS3-specific monoclonal antibodies (MAbs) in survival experiments in mice using a non-opsonic human IgM (A7), a non-opsonic mouse IgG1 (1E2) and an opsonic mouse IgG1 (5F6). The survival of A7- and PPS3-specific and isotype control MAb-treated neutrophil-depleted and neutrophil-sufficient and macrophage-depleted and macrophage-sufficient mice were determined after i.p. challenge with ST3 strains 6303 and WU2. Neutrophils were dispensable for A7 and the mouse MAbs to mediate protection in this model, but macrophages were required for the efficacy of A7 and optimal mouse MAb-mediated protection. For A7-treated mice, macrophage-depleted mice had higher blood CFU, cytokines and peripheral neutrophil levels than macrophage-sufficient mice, and macrophage-sufficient mice had lower tissue bacterial burdens than control MAb-treated mice. These findings demonstrate that macrophages contribute to opsonic and non-opsonic PPS3-specific MAb-mediated protection against ST3 infection by enhancing bacterial clearance and suggest that neutrophils do not compensate for the absence of macrophages in the model used in this study.


Figures

Figure 1
Figure 1. Survival after i.p. infection with (A) 30 CFU ST3 (6303) and (B) 50 CFU ST3 (WU2), comparing macrophage-depleted and macrophage-sufficient mice
The percent of PBS-, isotype control IgM-, PCN- and A7-treated mice surviving after i.p. infection at the times designated on the x-axis is depicted. Open symbols represent macrophage-sufficient mice; closed symbols represent macrophage-depleted mice. *p<0.05 between groups for the designated treatments; Kaplan-Meier log rank survival test. N=6 mice per group.
Figure 2
Figure 2. Survival after i.p. infection with 50 CFU ST3 (WU2), comparing macrophage-depleted and macrophage-sufficient mice
The percent of PBS, 31B12-, 5F6- and 1E2-treated mice surviving after i.p. infection at the times designated on the x-axis is depicted. Open symbols represent macrophage-sufficient mice; closed symbols represent macrophage-depleted mice. *p<0.05 between groups for the designated treatments; Kaplan-Meier log rank survival test. N=6–22 mice per group.
Figure 3
Figure 3. Survival after i.p. infection with 30 CFU ST3 (6303) in (A) wild-type mice and (B) TLR2−/− mice
The percent survival of PBS-, control IgM-, and A7-treated mice surviving after i.p. infection at the times designated on the x-axis is depicted. *P<0.05 for comparison to A7 treated groups; Kaplan-Meier log rank survival test. N=7–8 mice per group.
Figure 4
Figure 4. Survival after i.p. infection with (A) 30 CFU ST3 (6303) and (B) 100 CFU ST3 (WU2), comparing neutrophil- depleted and neutrophil-sufficient mice
The percent of PBS-, A7, 5F6 and 1E2-treated mice surviving after i.p. infection at the times designated on the x-axis is depicted. Closed symbols represent rIgG-treated mice; open symbols represent RB6-treated mice. *p<0.05 between groups for the designated treatments; Kaplan-Meier log rank survival test. N=5 mice per group.
Figure 5
Figure 5. Bacterial burden after i.p. infection with 30 CFU ST3 (6303)
CFU in the peritoneal cavity, blood, liver and lung in macrophage-sufficient mice (A) and blood (B) and peritoneal cavity (C) in macrophage-depleted mice 18 hr after i.p. infection. Black bars represent macrophage-sufficient mice; gray bars represent macrophage-depleted mice (B and C). Each bar represents the mean + SEM (A) or median (B and C) of the designated group. * p<0.05 comparing A7 treatment groups; # p< 0.05 comparing A7 treatment groups to PBS and control IgM treatment groups; unpaired t test (A), Mann-Whitney U test (B and C). N=5–15 mice per group. The lowest limit of detection for this assay is 20 CFU.
Figure 6
Figure 6. Liver IL-6 (A) and KC (B) concentrations 18 hours after infection with 30 CFU ST3 (6303)
Levels of liver IL-6 and KC are shown on the y-axis for uninfected, control IgM- and A7-treated mice. * p<0.05 comparing A7 to PBS treatment groups; # P<0.001 comparing A7 to IgM treatment group, Mann-Whitney U test. N=4–10 mice per group.
Figure 7
Figure 7. Serum and spleen KC and IL-6 concentrations 18 hr after infection with 30 CFU ST3 (6303)
Black bars represent macrophage-sufficient mice; gray bars represent macrophage-depleted mice. Each bar represents the median of the designated group. * p<0.05 comparing A7 treatment groups; # p< 0.05 comparing A7 treatment groups to PBS and control IgM treatment groups, Mann-Whitney U test. N=4–7 mice per group. The lowest limit of detection for both KC and IL-6 is 7.8 pg/ml.
Figure 8
Figure 8. Total white blood cell count and differential after i.p. infection with 30 CFU ST3 (6303)
Total leukocytes (A), lymphocytes (B), neutrophils (C) and monocytes (D) enumerated 18 hr after i.p infection. Each bar represents the median of the designated group. * p<0.05 between groups for the designated treatments, Mann Whitney U test. N=4–9 mice per group.

References

    1. Martinez JE, Romero-Steiner S, Pilishvili T, et al. A flow cytometric opsonophagocytic assay for measurement of functional antibodies elicited after vaccination with the 23-valent pneumococcal polysaccharide vaccine. Clin Diag Lab Immunol. 1999;6:581–586. - PMC - PubMed
    1. Romero-Steiner S, Frasch CE, Carlone G, Fleck RA, Goldblatt D, Nahm MH. Use of opsonophagocytosis for serological evaluation of pneumococcal vaccines. Clin Vaccine Immunol. 2006 Feb;13(2):165–169. - PMC - PubMed
    1. Martinez JE, Clutterbuck EA, Li H, Romero-Steiner S, Carlone GM. Evaluation of multiplex flow cytometric opsonophagocytic assays for determination of functional anticapsular antibodies to Streptococcus pneumoniae. Clin Vaccine Immunol. 2006 Apr;13(4):459–466. - PMC - PubMed
    1. Romero-Steiner S, Libutti D, Pais LB, et al. Standardization of an opsonophagocytic assay for the measurement of functional antibody activity against Streptococcus pneumoniae using differentiated HL-60 cells. Clin Diagn Lab Immunol. 1997;4:415–422. - PMC - PubMed
    1. Burns T, Abadi M, Pirofski L. Modulation of the lung inflammatory response to serotype 8 pneumococcus infection by a human monoclonal IgM to serotype 8 capsular polysaccharide. Infect Immun. 2005;73:4530–4538. - PMC - PubMed

Publication types