. 2010 Nov;36(11):1907-18.
doi: 10.1016/j.ultrasmedbio.2010.05.014.

Analysis of in vitro transfection by sonoporation using cationic and neutral microbubbles

Affiliations

Analysis of in vitro transfection by sonoporation using cationic and neutral microbubbles

Jose L Tlaxca et al. Ultrasound Med Biol. 2010 Nov.

Abstract

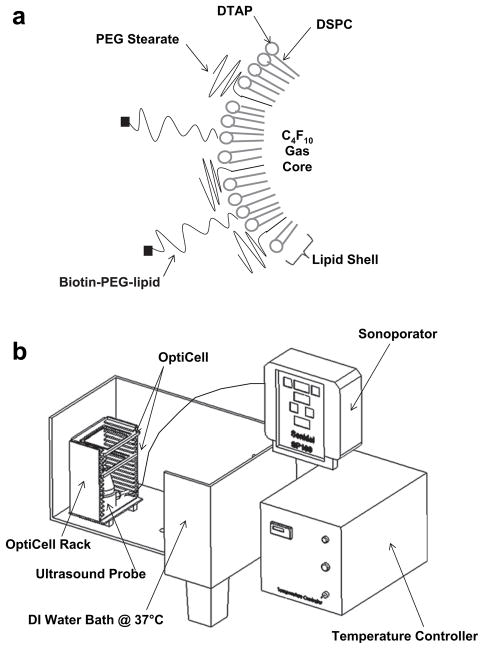
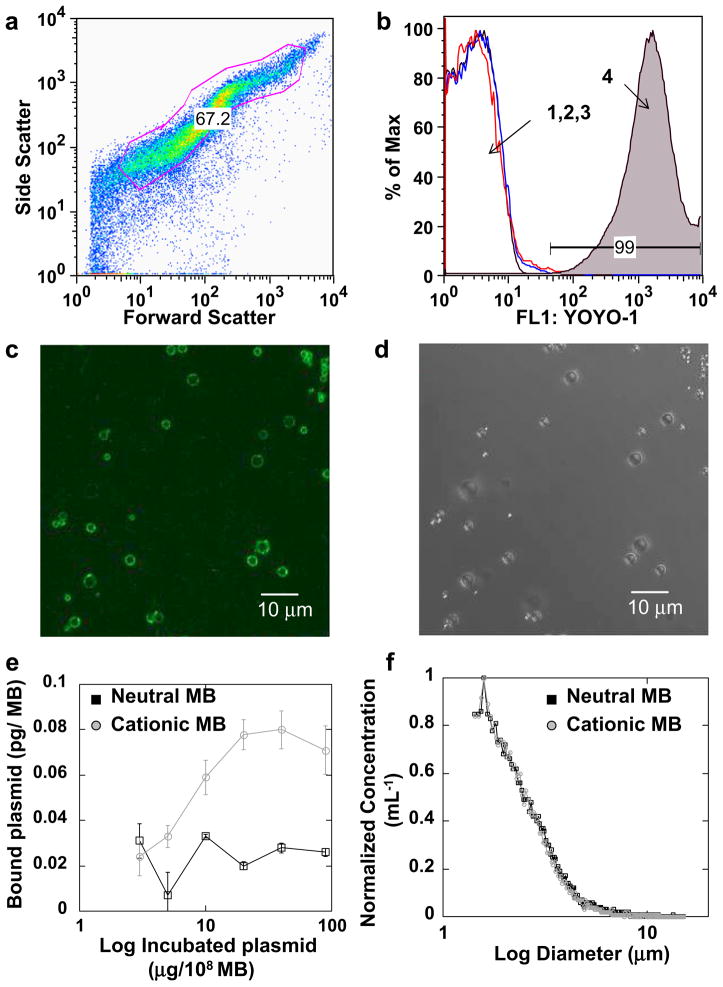
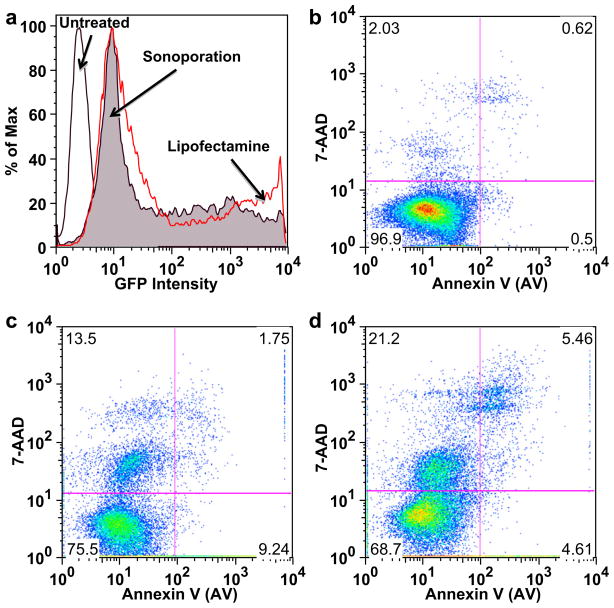
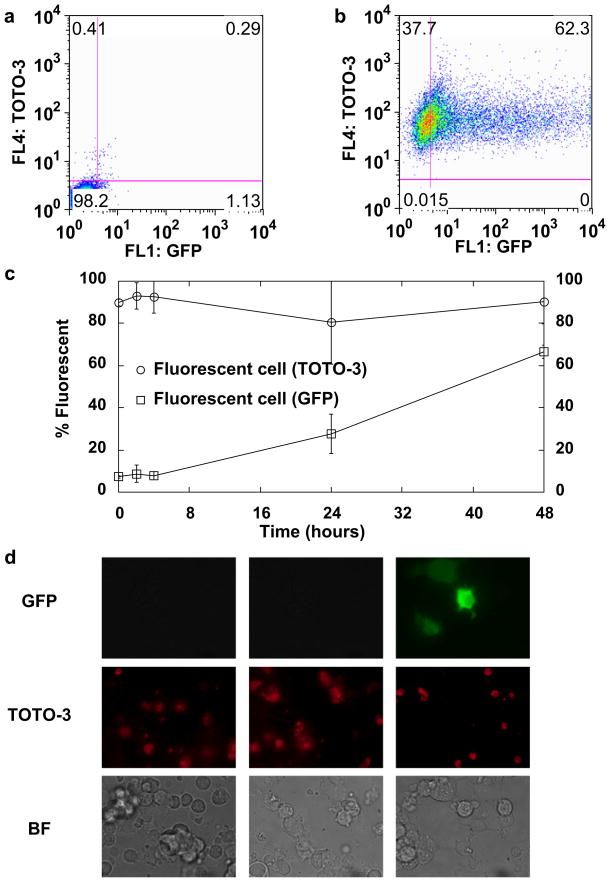
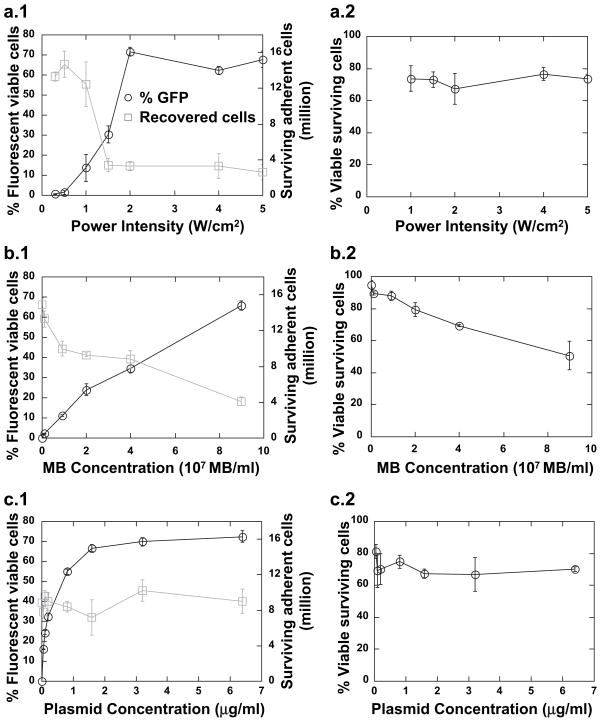
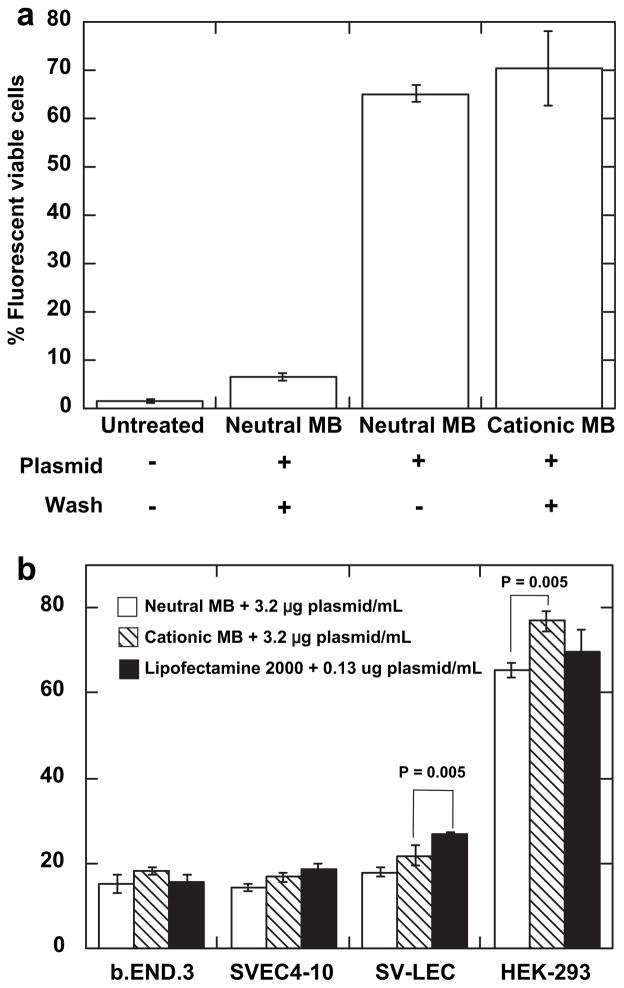
The objective of the study was to examine the role of acoustic power intensity and microbubble and plasmid concentrations on transfection efficiency in HEK-293 cells using a sonoporator with a 1-MHz transducer. A green fluorescent protein (GFP) reporter plasmid was delivered in as much as 80% of treated cells, and expression of the GFP protein was observed in as much as 75% of cells, using a power intensity of 2 W/cm(2) with a 25% duty cycle. In addition, the relative transfection abilities of a lipid noncationic and cationic microbubble platform were investigated. As a positive control, cells were transfected using Lipofectamine reagent. Cell survival and transfection efficiency were inversely proportional to acoustic power and microbubble concentration. Our results further demonstrated that high-efficiency transfection could be achieved, but at the expense of cell loss. Moreover, direct conjugation of plasmid to the microbubble did not appear to significantly enhance transfection efficiency under the examined conditions, although this strategy may be important for targeted transfection in vivo.


Figures

Fig. 1
Fig. 1
Experimental setup for transfection by sonoporation. (a) Schematic of MBs used in this experiment. Microbubbles were composed of a perfluorocarbon gas core encapsulated by a lipid and PEG-stearate shell. Cationic MBs contained a small amount of positively charged DTAP lipid and biotin-PEG-lipid. (b) Cell monolayers were cultured in 10 mL OptiCells, and MBs and plasmid were injected and mixed immediately before ultrasound treatment. The ultrasound transducer was hand-held in the heater water bath 50 mm below the OptiCell cell culture monolayer. A second OptiCell was used as a guide to maintain the correct separation distance of 50 mm. Buoyancy caused the MBs to rest against the cell monolayer in upper OptiCell membrane.
Fig. 2
Fig. 2
Plasmid conjugation to MB surface. Plasmid DNA was electrostatically coupled to the cationic MBs and subsequently labeled with YOYO-1. (a) Forward vs. side scatter of cationic MBs bearing plasmid labeled with YOYO-1, with gate showing the population of MBs analyzed. (b) Fluorescence histogram for (1) naked cationic MBs, (2) naked cationic MBs incubated with YOYO-1 and (3) neutral MBs incubated with plasmid and YOYO-1 showed low signal, whereas (4) cationic MBs incubated with plasmid and YOYO-1 showed a significant fluorescence signal. (c) Epifluorescent and (d) corresponding bright field microscopy showed co-localization of YOYO-1–stained plasmid with cationic MBs. (e) Photometric quantification of plasmid per MB, for both neutral and cationic MBs. (f) Microbubble size and normalized concentration.
Fig. 3
Fig. 3
Flow cytometric analysis of HEK-293 viability and GFP expression. (a) Characteristic GFP intensity histogram on viable HEK-293 cells showing (1) minimal background fluorescence for untreated cells (unfilled black curve); (2) GFP expression in cells treated by Lipofectamine (open red curve); and (3) sonoporation with MBs (filled curve). Characteristic viability plots: (b) untreated healthy stained cells, (c) Cells transfected with pMax-GFP by Lipofectamine-2000 or (d) by sonoporation with MBs (2.0 W/cm2, duty cycle of 25%, 4 × 10⁷ neutral MBs per mL and 3.2 μg/mL of pMax-GFP plasmid).
Fig. 4
Fig. 4
Time course of plasmid delivery and transfection. (a) Characteristic dot plot of untreated cells and (b) cells 48 h after treatment. (c) GFP (squares) and TOTO-3 (circles) signal measured by flow cytometry as a function of time after sonoporation treatment. (d) Characteristic epifluorescence and corresponding brightfield microscopy images of sonoporated cells at various time points: 0, 4 and 12 h, respectively. Data shown as mean ± standard deviation of Opticells (n = 4). HEK-293 cells were sonoporated at 2.0 W/cm2, duty cycle of 25%, for 3 min with 4 × 10⁷ neutral MBs per mL and 3.2 μg/mL of pMax-GFP plasmid labeled with TOTO-3 for all sonoporation experiments presented here.
Fig. 5
Fig. 5
Transfection efficiency, recovery and viability as a function of sonoporation parameters. HEK-293 cells were incubated with neutral MBs and plasmid at the indicated concentrations, sonoporated for 3 min at 1.0 MHz and a duty cycle of 25% and assessed by flow cytometry 48 h post treatment. (a) Variable power intensity: cells were incubated with 3.2 μg/mL plasmid DNA and 4 × 107 MB/mL. (b) Variable MB concentration: cells were insonated at 2 W/cm2 with 0.4 μg/mL plasmid. (c) Variable plasmid concentration: cells were incubated with 4 × 107 MB/mL and insonated at 2 W/cm2. Data shown as mean ± standard deviation of OptiCells (n = 4).
Fig. 6
Fig. 6
Transfection efficiency comparison. A MB concentration of 4 × 107 MB/mL was used for each experiment. Cells were insonated at 2.0 W/cm2 for 3 min at a duty cycle of 25% and then harvested 48 h post-treatment and analyzed by flow cytometry. (a) Neutral and cationic MBs were incubated with 8 μg of pmaxGFP plasmid per 108 MB and then washed to remove unbound plasmid. As controls, cells were also treated with neutral MBs plus 8 μg/mL plasmid free in solution, or no ultrasound treatment. (b) Comparison of sonoporation and Lipofectamine transfection methods on various adherent cell types. Cells were treated with 3.2 μg/mL plasmid and 4 × 107 MB/mL cationic or neutral MBs, or 0.13 μg/mL plasmid and Lipofectamine. Data shown as mean ± standard deviation for OptiCells (n = 4).

References

    1. Ando T, Jordan P, Joh T, Wang Y, Jennings MH, Houghton J, Alexander JS. Isolation and characterization of a novel mouse lymphatic endothelial cell line: SV-LEC. Lymphat Res Biol. 2005;3:105–115. - PubMed
    1. Bao S, Thrall BD, Miller DL. Transfection of a reporter plasmid into cultured cells by sonoporation in vitro. Ultrasound Med Biol. 1997;23:953–959. - PubMed
    1. Bekeredjian R, Chen S, Frenkel PA, Grayburn PA, Shohet RV. Ultrasound-targeted microbubble destruction can repeatedly direct highly specific plasmid expression to the heart. Circulation. 2003;108:1022–1026. - PubMed
    1. Burke B, Sumner S, Maitland N, Lewis CE. Macrophages in gene therapy: Cellular delivery vehicles and in vivo targets. J Leukoc Biol. 2002;72:417–428. - PubMed
    1. Chang DC, Reese TS. Changes in membrane structure induced by electroporation as revealed by rapid-freezing electron microscopy. Biophys J. 1990;58:1–12. - PMC - PubMed

Publication types

LinkOut - more resources