. 2010 Dec;139(6):2005-17.
doi: 10.1053/j.gastro.2010.08.043. Epub 2010 Aug 27.

Helicobacter pylori infection promotes methylation and silencing of trefoil factor 2, leading to gastric tumor development in mice and humans

Affiliations

Helicobacter pylori infection promotes methylation and silencing of trefoil factor 2, leading to gastric tumor development in mice and humans

Anthony J Peterson et al. Gastroenterology. 2010 Dec.

Abstract

Background & aims: Trefoil factors (TFFs) regulate mucosal repair and suppress tumor formation in the stomach. Tff1 deficiency results in gastric cancer, whereas Tff2 deficiency increases gastric inflammation. TFF2 expression is frequently lost in gastric neoplasms, but the nature of the silencing mechanism and associated impact on tumorigenesis have not been determined.

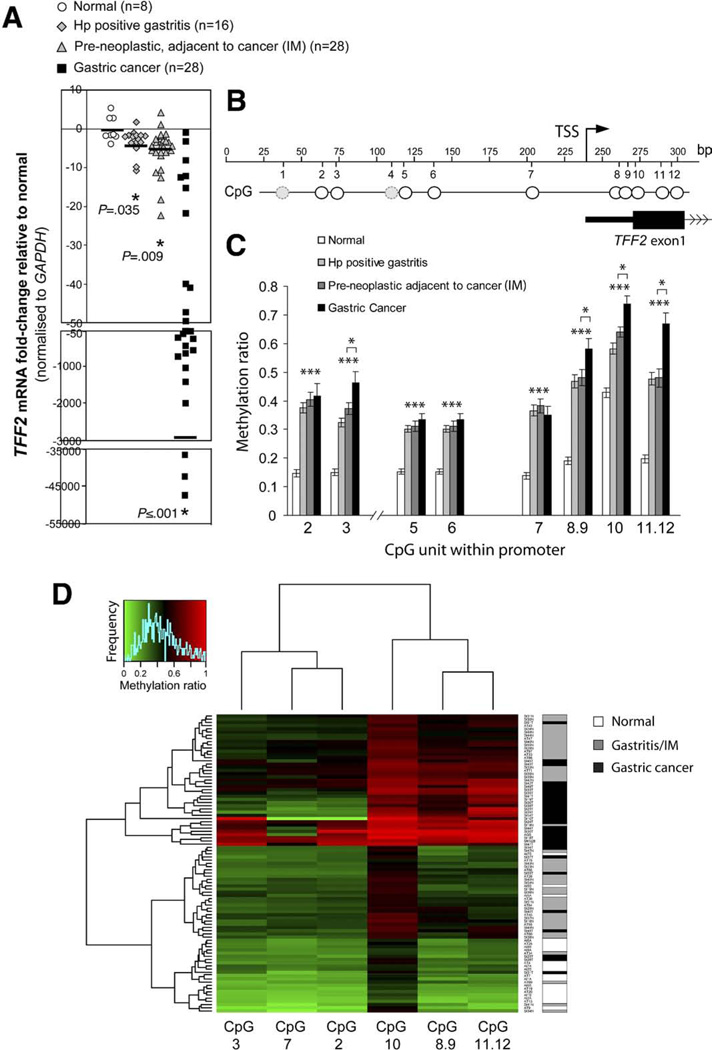
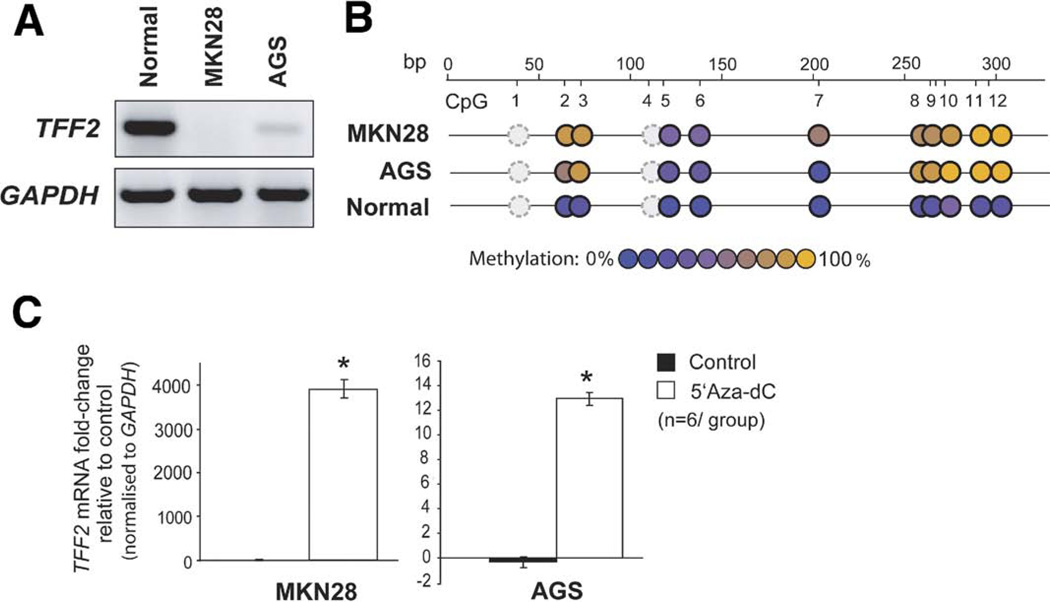
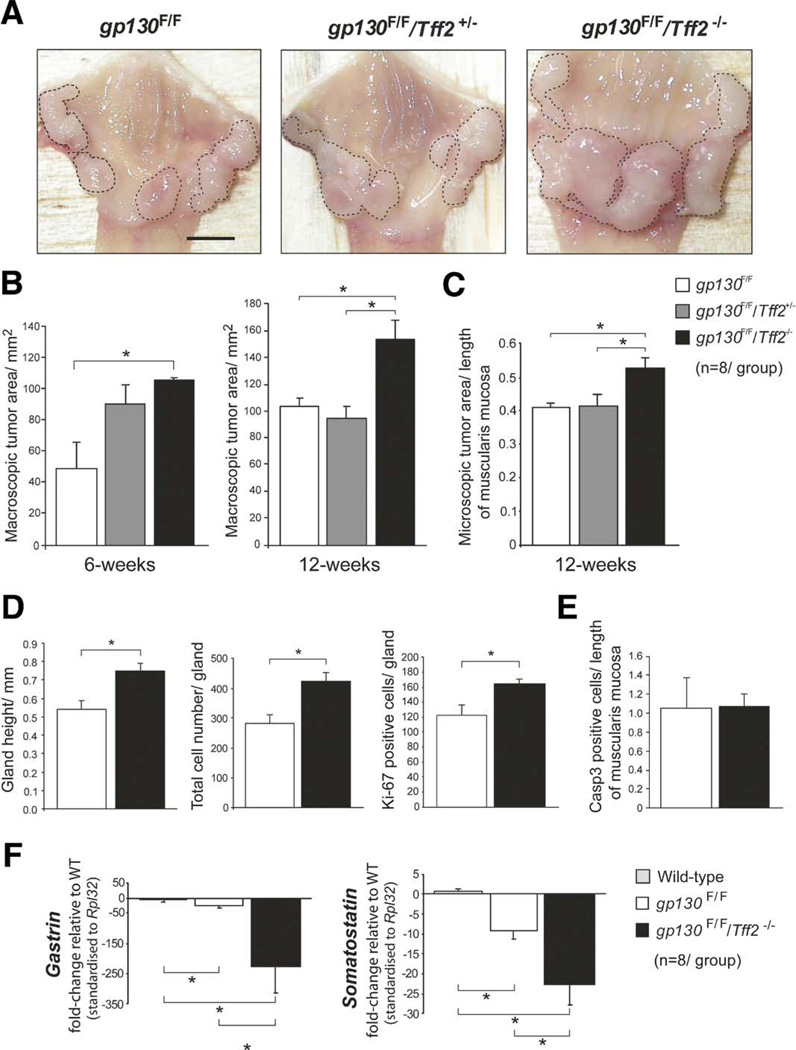
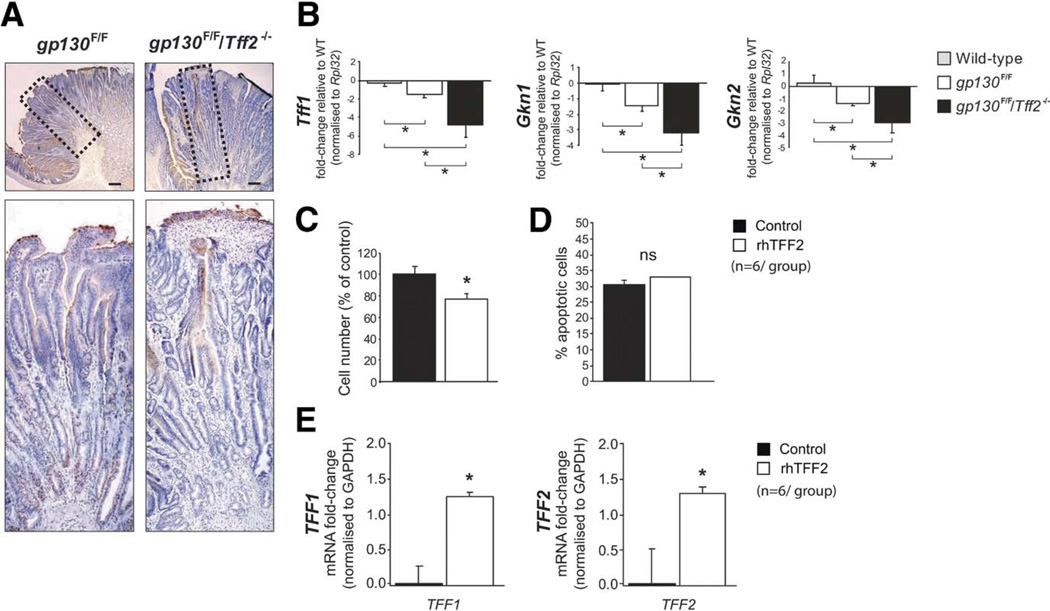
Methods: We investigated the epigenetic silencing of TFF2 in gastric biopsy specimens from individuals with Helicobacter pylori-positive gastritis, intestinal metaplasia, gastric cancer, and disease-free controls. TFF2 function and methylation were manipulated in gastric cancer cell lines. The effects of Tff2 deficiency on tumor growth were investigated in the gp130(F/F) mouse model of gastric cancer.

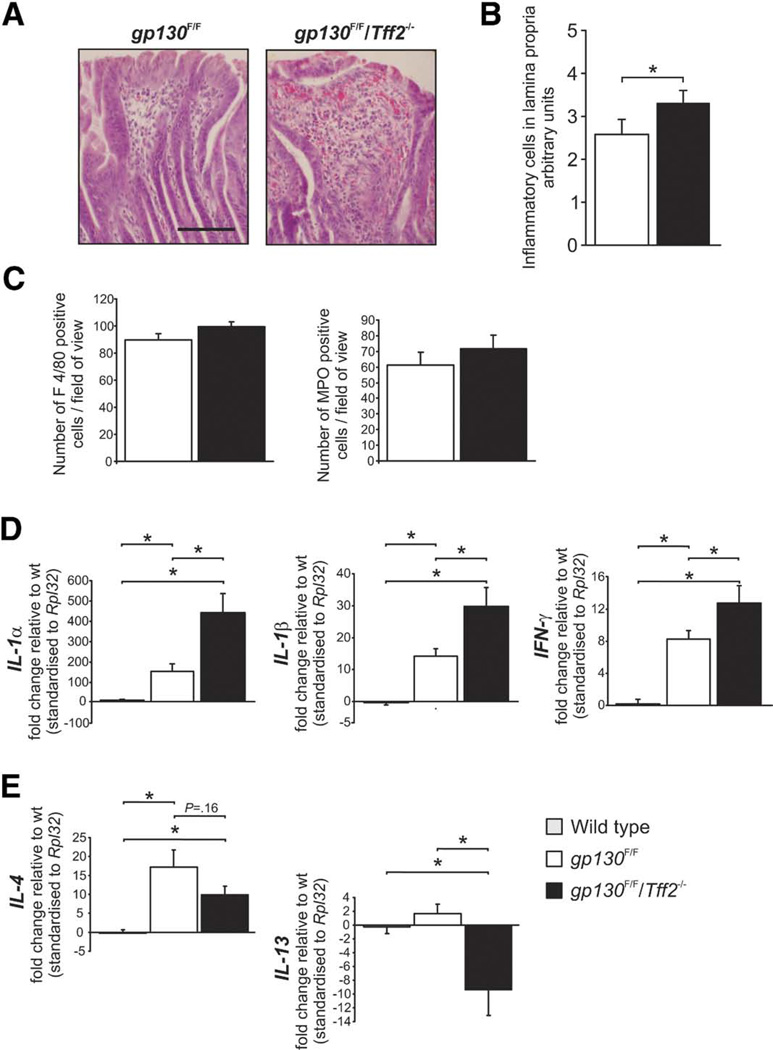
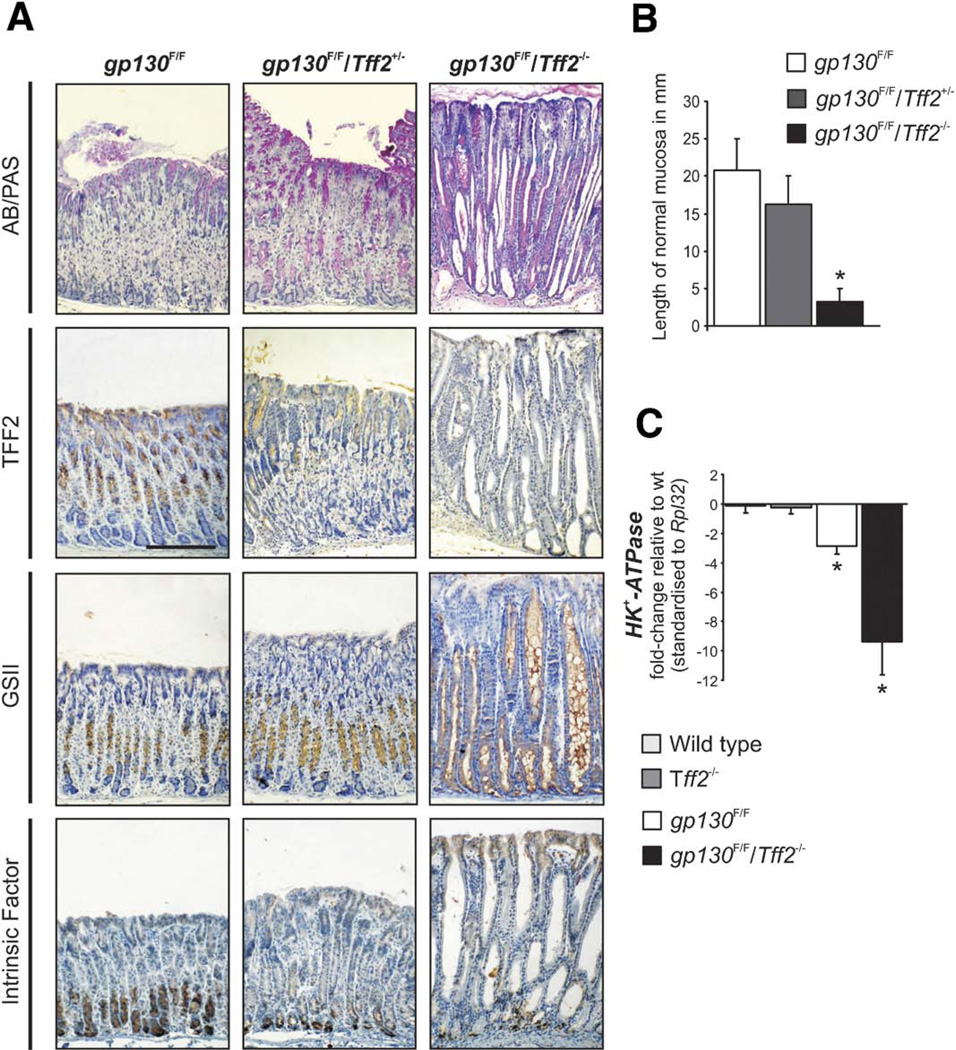
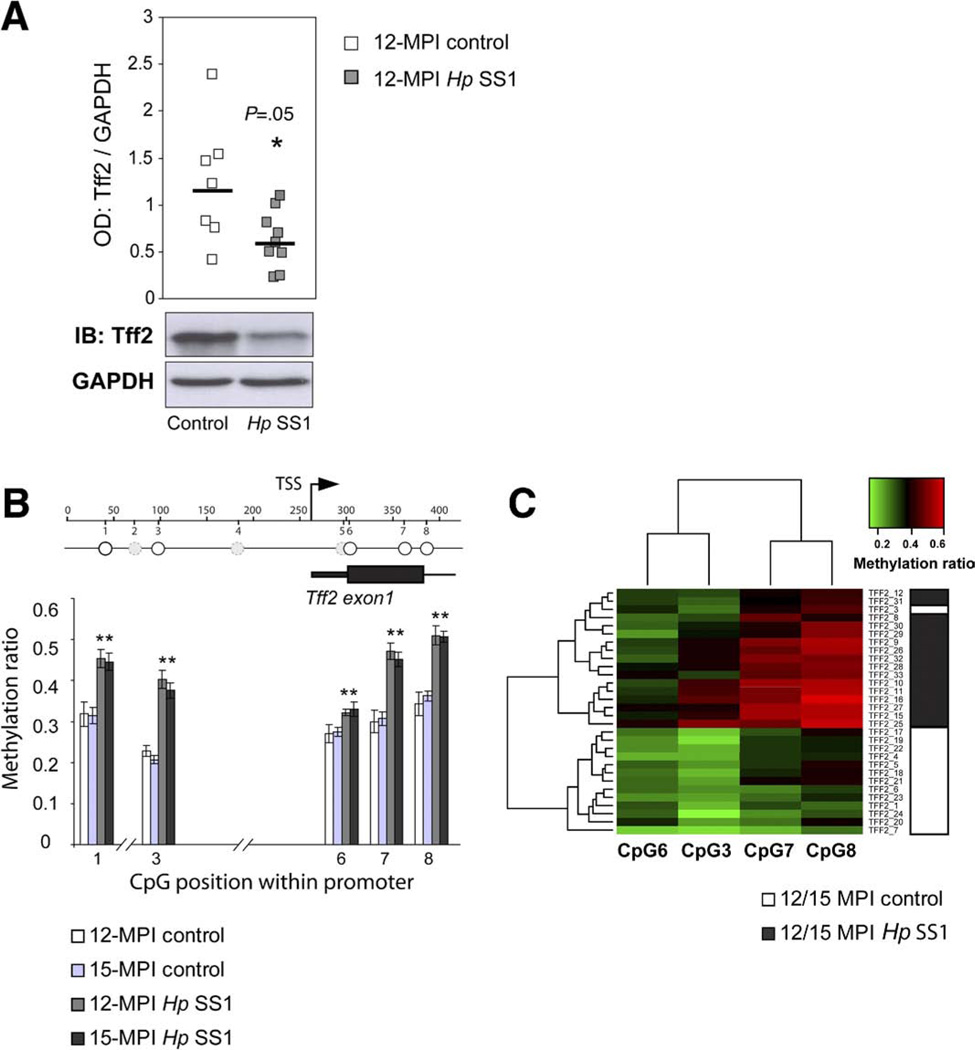
Results: In human tissue samples, DNA methylation at the TFF2 promoter began at the time of H pylori infection and increased throughout gastric tumor progression. TFF2 methylation levels were inversely correlated with TFF2 messenger RNA levels and could be used to discriminate between disease-free controls, H pylori-infected, and tumor tissues. Genome demethylation restored TFF2 expression in gastric cancer cell lines, so TFF2 silencing requires methylation. In Tff2-deficient gp130(F/F)/Tff2(-/-) mice, proliferation of mucosal cells and release of T helper cell type-1 (Th-1) 1 cytokines increased, whereas expression of gastric tumor suppressor genes and Th-2 cytokines were reduced, compared with gp130(F/F)controls. The fundus of gp130(F/F)/Tff2(-/-) mice displayed glandular atrophy and metaplasia, indicating accelerated preneoplasia. Experimental H pylori infection in wild-type mice reduced antral expression of Tff2 by increased promoter methylation.

Conclusions: TFF2 negatively regulates preneoplastic progression and subsequent tumor development in the stomach, a role that is subverted by promoter methylation during H pylori infection.


Conflict of interest statement

Conflicts of interest

The authors disclose no conflicts.

Figures

Figure 1
Figure 1
Increased TFF2 promoter methylation correlates with loss of expression in gastric cancer. (A) QRT-PCR analysis of TFF2 messenger RNA (mRNA) levels in human gastric mucosal tissues (n = 91); graph shows mRNA fold-change relative to normal stomach; black bars show mean fold-change. Asterisks show statistical significance (P < .05). (B) TFF2 promoter region scanned by EPITYPER methylation analysis. Wide black box shows coding regions; narrow black box shows 5′ UTR: arrowheads show transcriptional orientation; TFF2 transcription start site (TSS); base pair (bp) positions are indicated; solid-line circles show CpGs covered by the analysis; broken-line circles show nonanalyzed CpGs. (C) EPITYPER DNA methylation analysis in human gastric mucosal tissues described in A. Bar graph shows mean CpG methylation ratios (levels). CpG units in pairs 8–9 and 11–12, respectively, are shown as combined averages (the constituent CpG units were not resolved by the EPITYPER assay). Asterisks show statistical significance (P < .05). (D) Two-way hierarchical cluster analysis of TFF2 promoter methylation levels (columns) against human tissue samples (rows). Classification of the human gastric mucosal tissues is shown on the right: open boxes (normal stomach), shaded boxes (H pylori-positive gastritis/preneoplastic adjacent to cancer with IM), solid boxes (gastric cancer). CpG methylation ratios 0 (green) to 1.0 (red; see color key). Histogram shows CpG/methylation ratio frequency.
Figure 2
Figure 2
TFF2 is re-expressed following genome demethylation. (A) Semiquantitative RT-PCR analysis of TFF2 messenger RNA (mRNA) expression in normal gastric antrum, MKN28 cells, and AGS cells. GAPDH demonstrates complementary DNA (cDNA) integrity. (B) EPITYPER analysis of TFF2 promoter methylation of samples shown in A. Epigrams show CpG methylation ratios: graded from blue (0; hypomethylated) to yellow (1; hypermethylated). Base pair (bp) positions are indicated; solid circles show CpGs covered by the analysis; faded circles show nonanalyzed CpGs. (C) QRT-PCR analysis of TFF2 expression in MKN28 cells and AGS cells treated with 10 µmol/L 5′Aza-dC for 72 hours compared with mock-treated controls (n = 6). Histograms show mean mRNA fold-change relative to untreated control. Asterisks show statistical significance (P < .05).
Figure 3
Figure 3
Morphometric analysis of antral tumors in gp130F/F/Tff2−/− mice. (A) Images of antral tumors in 12-week-old mice; tumor areas are defined with dotted outlines; scale bar shows 5 mm. (B) Macroscopic morphometric analysis of antral tumor area in 6- and 12-week-old mice. (C) Microscopic morphometric analysis of tumor area (standardized to length of muscularis mucosa) in 12-week-old mice. (D) Antral gland height; cell number per antral gland; proliferating cells by quantitative Ki-67 immunohistochemistry. (E) Localization of apoptotic cells by quantitative activated caspase (casp) 3 immunohistochemistry. (F) QRT-PCR analysis of Gastrin and Somatostatin messenger RNA (mRNA) expression. Histograms show mean mRNA fold change relative to wild-type. Asterisks show statistical significance (P < .05).
Figure 4
Figure 4
Loss of gastric tumor suppressor gene expression in gp130F/F/Tff2−/− antral tumors. (A) Immunohistochemical localization of Tff1 in antral tumors. (B) QRT-PCR analysis of Tff1, Gkn1, and Gkn2. Histograms show mean messenger RNA (mRNA) fold change relative to wild type. (C) Proliferation determined by viable cell counts in AGS cells following treatment with 50 µg/mL recombinant human (rh) TFF2 for 48 hours (n = 20). (D) Apoptosis measured by Annexin V flow cytometry in AGS cells treated with 50 µg/mL rhTFF2 for 48 hours (n = 5). (E) QRT-PCR analysis of TFF1 and TFF2 mRNA expression in AGS cells treated with 50 µg/mL rhTFF2 for 48 hours (n = 6). Asterisks show statistical significance (P < .05).
Figure 5
Figure 5
Analysis of inflammatory mediators in gp130F/F/Tff2−/− antral tumors. (A) Representative H&E sections showing intramucosal inflammation in the lamina propria within tumors; scale bar shows 50 µm. (B) Semiquantitative gradation of tumor-associated inflammatory leukocyte infiltrate. (C) Quantitative immunohistochemistry of tumor-associated, activated macrophages (F4/80) and neutrophils (MPO). QRT-PCR expression analysis in antral tumors of (D) Th1 cytokines: IL1α, IL1β, IFNγ. (E) Th2 cytokines: IL-13, IL-4. Histograms show mean messenger RNA fold change relative to wild type. Asterisks show statistical significance (P < .05).
Figure 6
Figure 6
Analysis of fundic atrophy in gp130F/F/Tff2−/− mice. (A) Immunohistochemical localization of Tff2 (MNCs), intrinsic factor (chief cells), GSII (MNCs); neutral/acidic mucins (AB/PAS). Scale bar shows 50 µm. (B) Quantitative morphometry of normal vs atrophic fundic mucosa. (C) QRT-PCR analysis of H+K+ATPase expression; histogram shows mean messenger RNA fold change relative to wild type. Asterisks show statistical significance (P < .05).
Figure 7
Figure 7
Tff2 promoter methylation is induced by experimental H pylori infection in mice. (A) Immunoblot analysis of Tff2 protein expression in stomachs of wild-type (C57BL6) mice at 12-month postinfection (12-MPI) with H pylori SS1 (Hp SS1) compared with noninfected controls. Horizontal black bars show mean optical density (OD) of Tff2 protein bands normalized to GAPDH. Representative protein bands from each group are shown below the scatterplots. (B) Quantitative Tff2 promoter methylation analysis (EPITYPER) in 12 and 15 MPI Hp SS1 and control stomach. Histograms show mean CpG methylation ratios. Asterisks show statistical significance (P < .05). Wide black box shows exon1 coding region; narrow black box shows exon1 5′ UTR; transcription start site (TSS); base pair (bp) positions are indicated; solid-line circles show CpGs covered by the analysis; broken-line circles show nonanalyzed CpGs. (C) Two-way hierarchical cluster analysis of Tff2 promoter methylation data (columns) against mouse samples (rows). Hp SS1 infection status classification is shown on the right: white boxes (12/15 MPI noninfected controls), black boxes (12/15 MPI Hp SS1). CpG methylation ratios: 0.2 (green; low) to 0.6 (red; high; see color key).

Similar articles

Cited by

References

    1. Wright NA, Hoffmann W, Otto WR, et al. Rolling in the clover: trefoil factor family (TFF)-domain peptides, cell migration and cancer. FEBS Lett. 1997;408:121–123. - PubMed
    1. Lefebvre O, Wolf C, Kedinger M, et al. The mouse one P-domain (pS2) and two P-domain (mSP) genes exhibit distinct patterns of expression. J Cell Biol. 1993;122:191–198. - PMC - PubMed
    1. Taupin DR, Pang KC, Green SP, et al. The trefoil peptides spasmolytic polypeptide and intestinal trefoil factor are major secretory products of the rat gut. Peptides. 1995;16:1001–1005. - PubMed
    1. Suemori S, Lynch-Devaney K, Podolsky DK. Identification and characterization of rat intestinal trefoil factor: tissue- and cell-specific member of the trefoil protein family. Proc Natl Acad Sci U S A. 1991;88:11017–11021. - PMC - PubMed
    1. Kindon H, Pothoulakis C, Thim L, et al. Trefoil peptide protection of intestinal epithelial barrier function: cooperative interaction with mucin glycoprotein. Gastroenterology. 1995;109:516–523. - PubMed

Publication types

MeSH terms