. 2010 Nov 30;49(10):1574-81.
doi: 10.1016/j.freeradbiomed.2010.08.019. Epub 2010 Aug 27.

Ferricytochrome c protects mitochondrial cytochrome c oxidase against hydrogen peroxide-induced oxidative damage

Affiliations

Ferricytochrome c protects mitochondrial cytochrome c oxidase against hydrogen peroxide-induced oxidative damage

Erik Sedlák et al. Free Radic Biol Med. .

Abstract

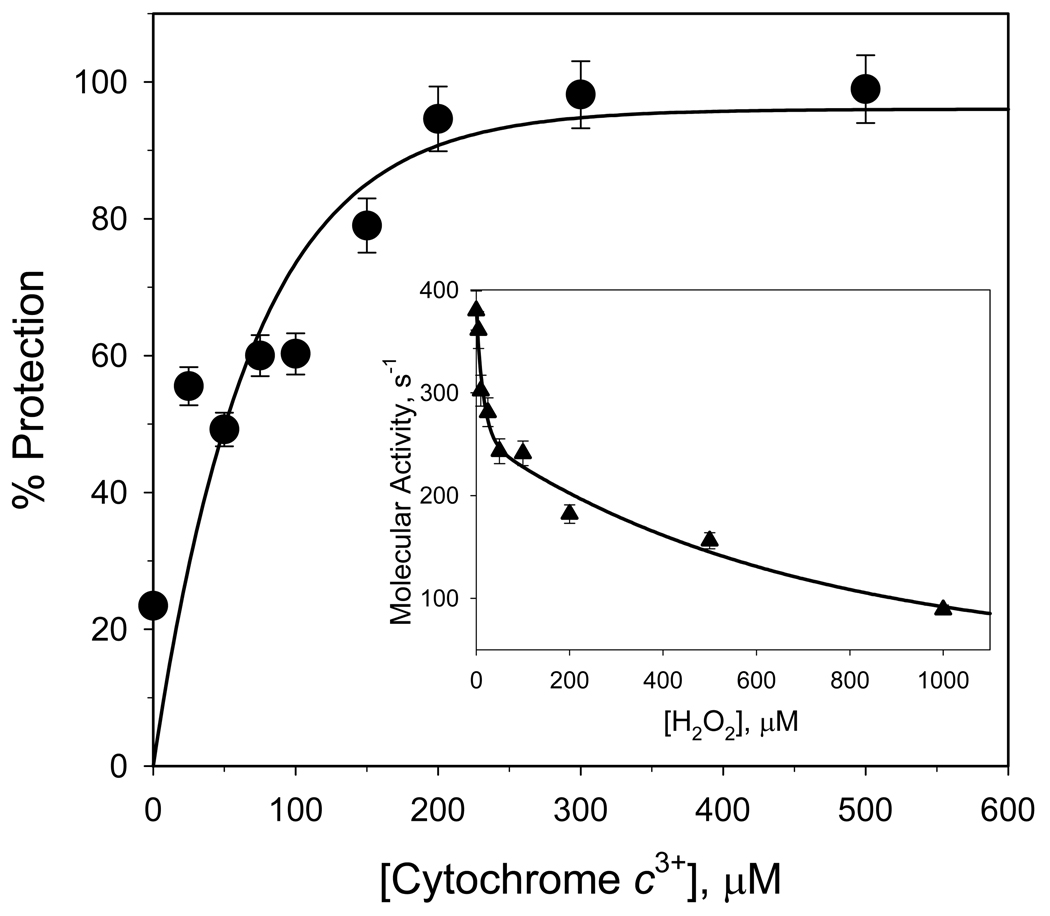
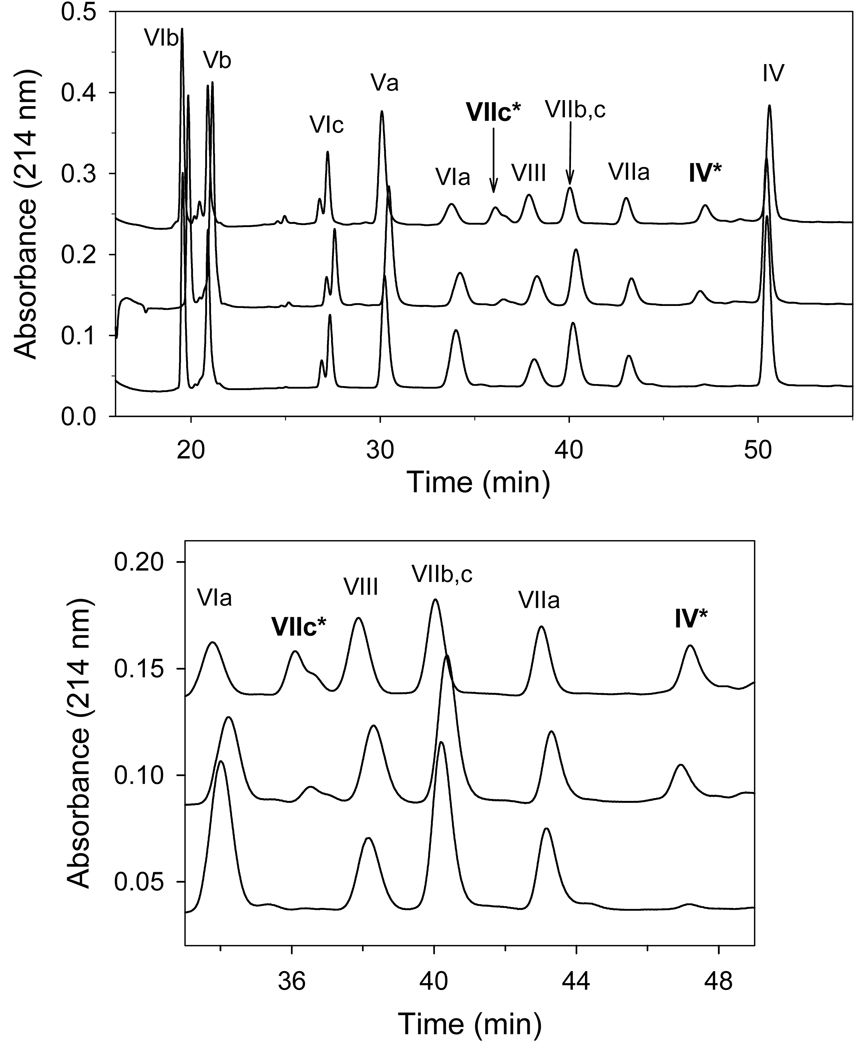
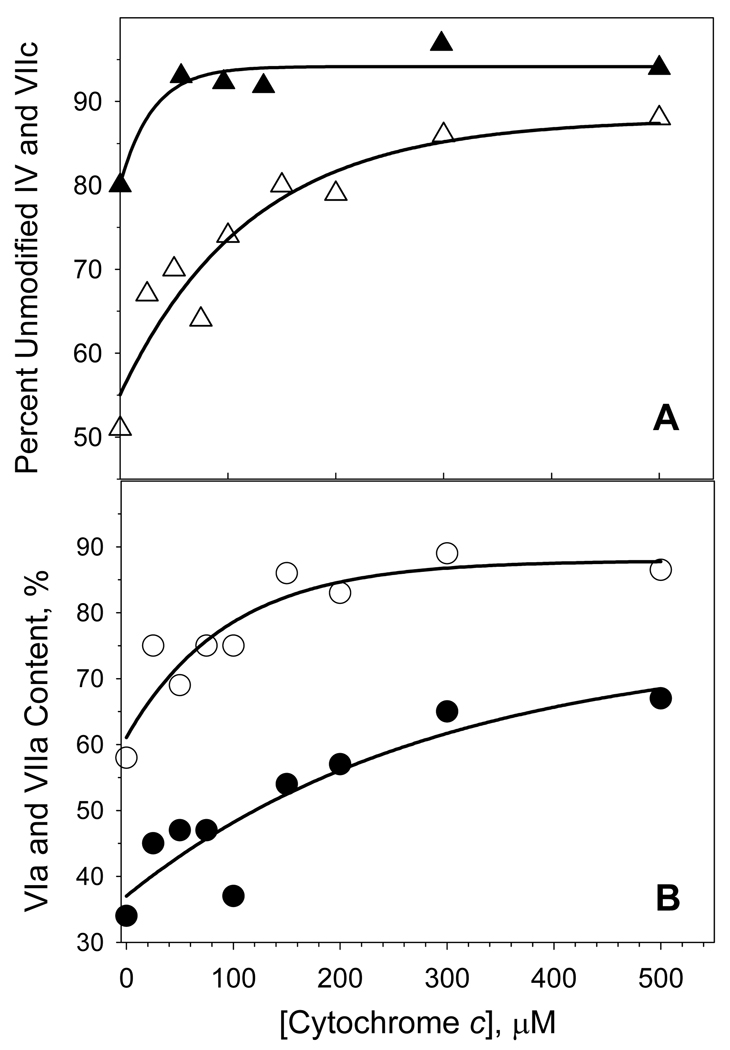
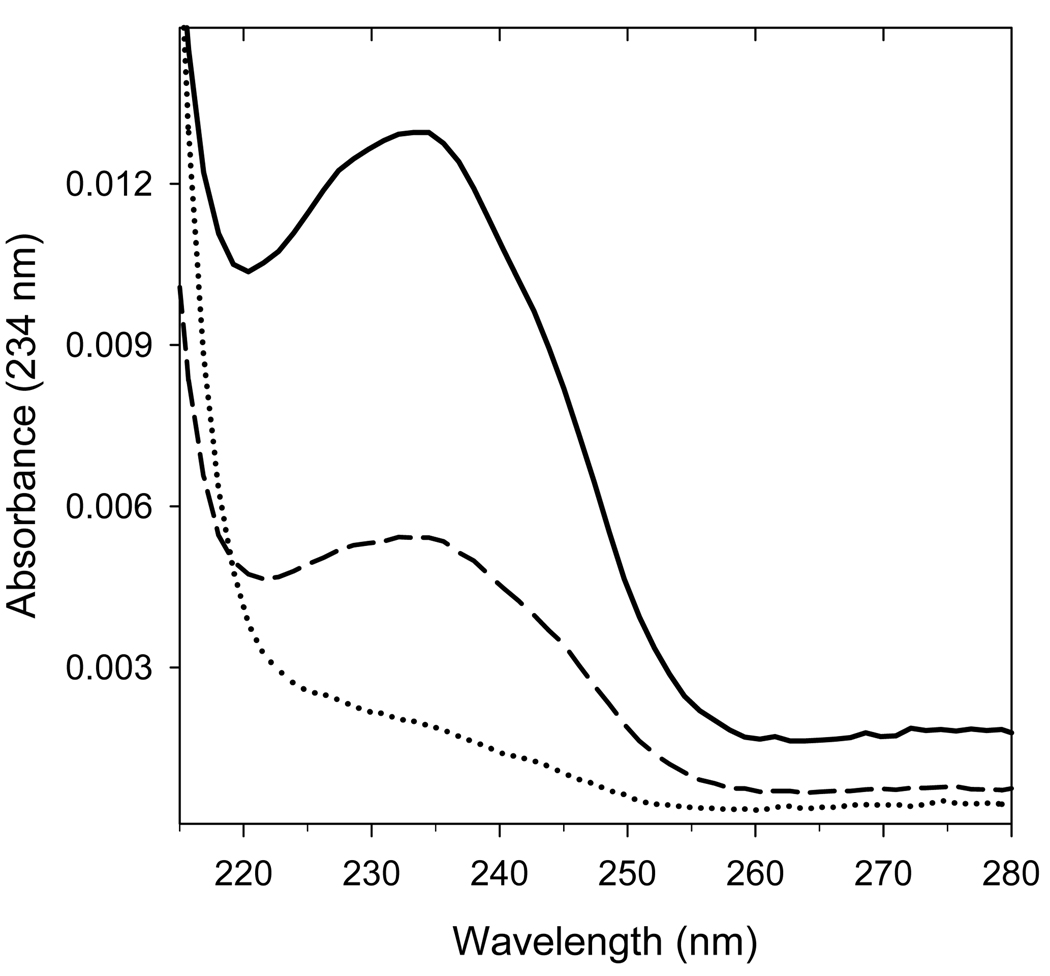
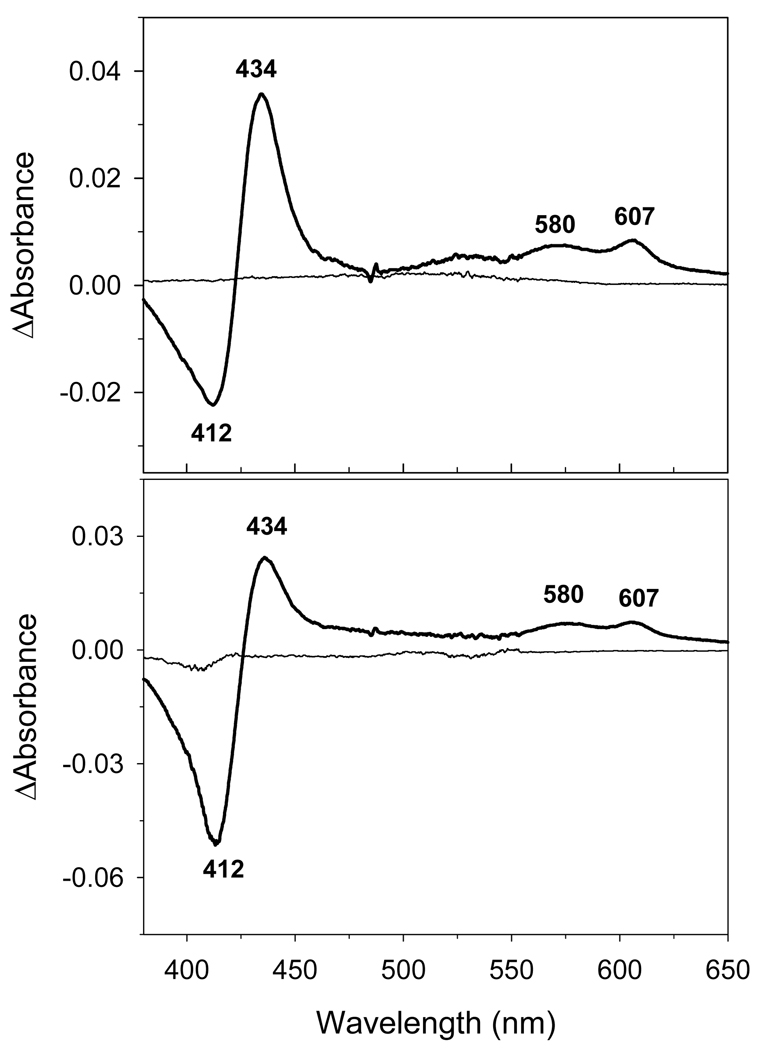
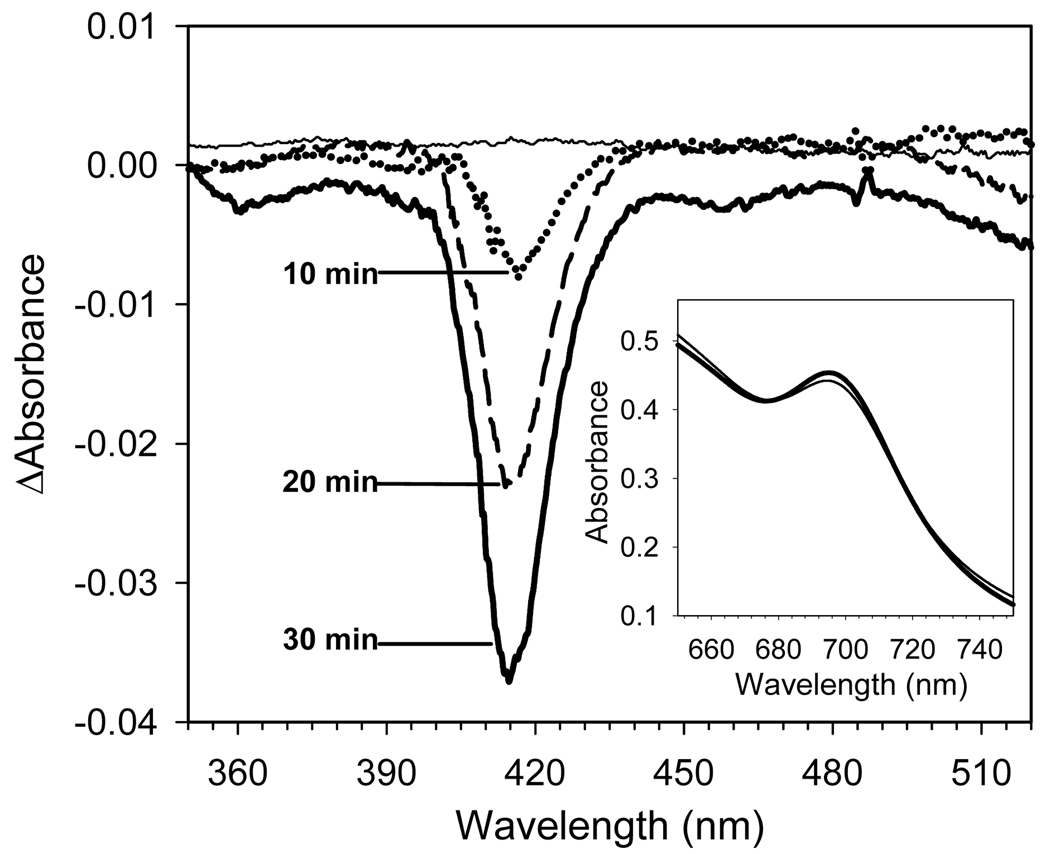
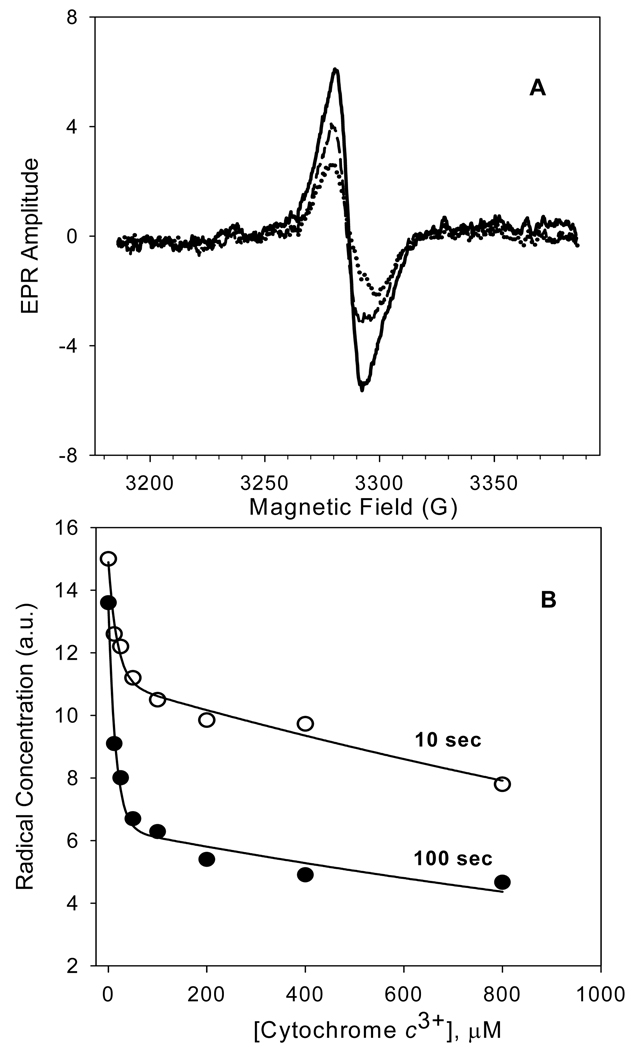
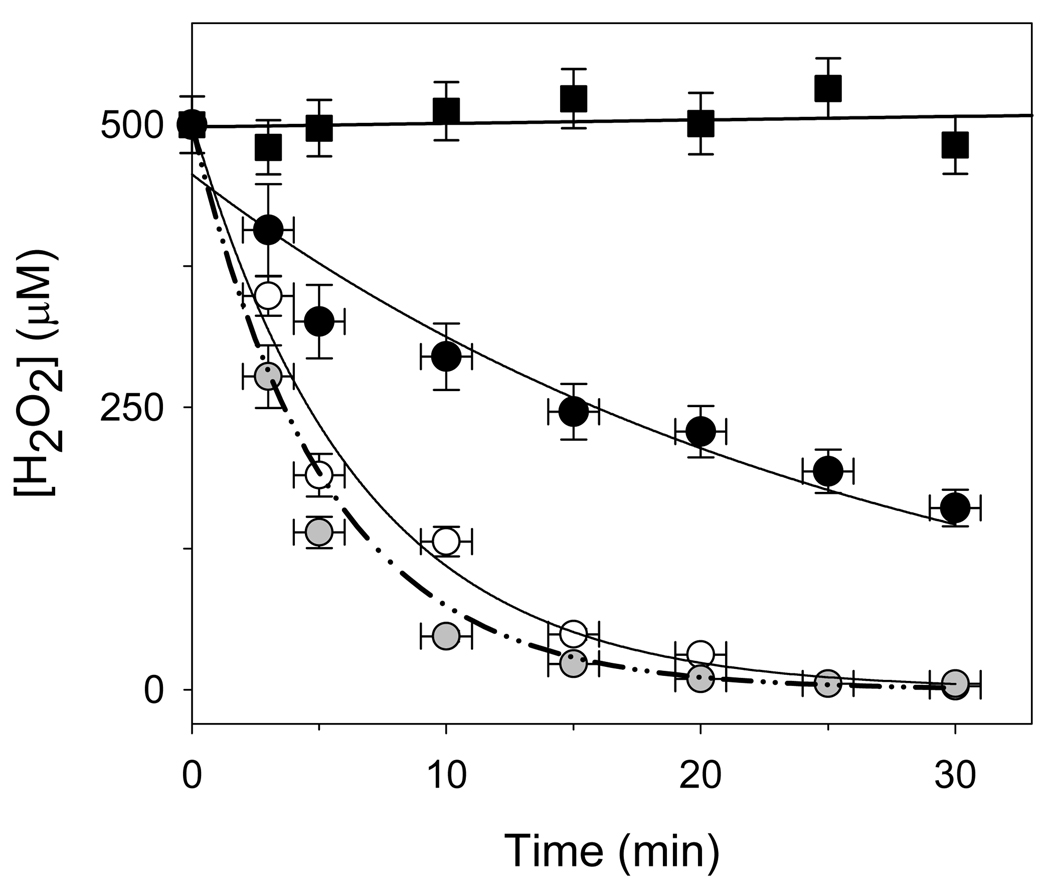
An excess of ferricytochrome c protects purified mitochondrial cytochrome c oxidase and bound cardiolipin from hydrogen peroxide-induced oxidative modification. All of the peroxide-induced changes within cytochrome c oxidase, such as oxidation of Trp(19,IV) and Trp(48,VIIc), partial dissociation of subunits VIa and VIIa, and generation of cardiolipin hydroperoxide, no longer take place in the presence of ferricytochrome c. Furthermore, ferricytochrome c suppresses the yield of H(2)O(2)-induced free radical detectable by electron paramagnetic resonance spectroscopy within cytochrome c oxidase. These protective effects are based on two mechanisms. The first involves the peroxidase/catalase-like activity of ferricytochrome c, which results in the decomposition of H(2)O(2), with the apparent bimolecular rate constant of 5.1±1.0M(-1)s(-1). Although this value is lower than the rate constant of a specialized peroxidase, the activity is sufficient to eliminate H(2)O(2)-induced damage to cytochrome c oxidase in the presence of an excess of ferricytochrome c. The second mechanism involves ferricytochrome c-induced quenching of free radicals generated within cytochrome c oxidase. These results suggest that ferricytochrome c may have an important role in protection of cytochrome c oxidase and consequently the mitochondrion against oxidative damage.


Figures

Figure 1
Figure 1. Ferricytochrome c protection of CcO from inactivation by H2O2
Main panel: Electron transfer activity of CcO after its exposure to H2O2 in the presence of different concentrations of cyt c3+. Cytochrome c oxidase (10 µM) was reacted with 500 µM H2O2 for 30 min in the presence of 0–500 µM ferricytochrome c. The reaction was stopped by removal of H2O2 using anion-exchange chromatography, and the remaining CcO activity determined spectrophotometrically. Data were fitted to a single-exponential rise to a maximum (solid line). Inset panel: Inactivation of CcO by H2O2 in the absence of cyt c3+. Cytochrome c oxidase (10 µM) was reacted with each concentration of H2O2 for 30 min., excess H2O2 removed by anion-exchange chromatography, and the remaining CcO activity determined spectrophotometrically. Data were fitted to a single-exponential decay (solid line). Assays were performed in triplicate using three different CcO preparations. The standard deviation in experiments was estimated to be ± 5.0%.
Figure 2
Figure 2. Cytochrome c oxidase nuclear-encoded subunit composition after exposure to H2O2 in the presence or absence of ferricytochrome c
Cytochrome c oxidase (10 µM) was reacted with 500 µM H2O2 in the presence of either 0, 300, or 500 µM cyt c3+ (top, middle and lower chromatograms). After 30 min., H2O2 and cyt c3+ were removed by HiTrap Q anion exchange chromatography and the nuclear-encoded subunit composition quantified by RP-HPLC analysis of 0.5 nmol of CcO [27]. Upper panel: RP-HPLC elution profile for all 10 of the nuclear-encoded subunits. Lower panel: Expanded profile between 33 to 49 min to better illustrate the elution of the H2O2 modified subunits (IV* and VIIc*). The data represents typical RP-HPLC profiles of three experiments using three different CcO preparations.
Figure 3
Figure 3. Ferricytochrome c protection of CcO subunits from H2O2-induced modifications
Panel A: Protection of CcO subunits IV (filled triangles) and VIIc (open triangles) from H2O2-induced oxidations by increasing cyt c3+ concentration. Panel B: Protection of CcO subunits VIa (filled circles), and VIIa (open circles) from H2O2-induced dissociation by increasing cyt c3+ concentration. The percent modification of each subunit was calculated from the areas of the relevant RP-HPLC elution peaks. Differences between chromatograms were normalized on the assumption that the area under the RP-HPLC peak corresponding to subunit Va remained constant. Solid lines are single-exponential fits to the data. The results are presented as an average of three measurements using three different preparations of CcO. The deviation in experiments was estimated to be ± 4.4%.
Figure 4
Figure 4. Excess cyt c3+ protects CcO-bound cardiolipin from H2O2-induced peroxidation
Peroxidized cardiolipin has a characteristic absorbance maximum at 234nm due to the presence of conjugated dienes; therefore, the extent of peroxidation can be determined from the UV spectrum of cardiolipin. The UV spectrum of HPLC-purified CL before (dotted line) and after exposure of CcO to 500 µM H2O2 in either the presence (dashed line), or absence (thick solid line) of excess cyt c3+. The UV spectrum was acquired online using a diode-array UV HPLC detector. In each case, cardiolipin was extracted from 2 nmole of CcO, dissolved in ethanol, and purified by HPLC. Nearly identical results were obtained for three different CcO preparations.
Figure 5
Figure 5. Generation of the H2O2-induced CcO oxy-intermediates is unaffected by the presence of excess cyt c3+
CcO P- and F-oxy-intermediates have a characteristic CcOP+F – CcOoxid difference spectrum with a minimum at 412 nm and maxima at 434, 580 and 607 nm. The difference spectrum for CcO was generated in silico by subtracting the digitized visible spectrum of 1.2 µM oxidized CcO in 20 mM Tris-Cl buffer, pH 7.4, with 2 mM dodecyl maltoside, from the digitized spectrum acquired after its reaction with 500 µM H2O2 for 30 min in absence and presence of cyt c3+. Upper Panel: H2O2-induced difference spectrum of CcO acquired in the absence of ferricytochrome c. Lower Panel: H2O2-induced difference spectral changes of cytochrome c oxidase in presence of 8 µM ferricytochrome c. In this case, the spectrum of ferricytochrome c was recorded, set to zero and was used as a reference (thin line). CcO was then added to make the solution 1.2 µM in CcO and the difference spectrum generated as described above. Concentrations of P- and F- forms were calculated using ΔΔε607–630 = 11 mM−1cm−1 for the P-form, and ΔΔε580–630 = 5.3 mM−1cm−1 for the F-form [32]. In both A and B forms of CcO hydrogen peroxide produces essentially the same amount of intermediates.
Figure 6
Figure 6. H2O2-induced bleaching of the visible spectrum of cyt c3+
Main Panel: Time-dependence of H2O2 –induced changes in the Soret difference spectrum of ferricytochrome c. Ferricytochrome c (500 µM) in 20 mM Tris-Cl pH 7.4 buffer containing 2 mM dodecyl maltoside was reacted with 500 µM H2O2 at room temperature. After 0, 10, 20 and 30 min, 10 µL aliquots were diluted 100-fold with reaction buffer and the absolute spectra were recorded. The absorption maxima in absolute spectra were 0.530, 0.527, 0.512, and 0.502, respectively. The difference spectrum was generated by subtracting the digitized visible spectrum of cyt c3+ before addition of H2O2 from the digitized spectrum acquired after its reaction with H2O2. Maximum absorbance in the Soret region decreased by only 0.6%, 3.5%, and 5.3% after 10, 20 and 30 min reaction of cyt c3+ with H2O2, dotted, dashed, and solid line, respectively. Inset Panel: H2O2-induced changes in the far visible spectrum of a mixture of cyt c3+ and CcO. Difference spectra were recorded for 500 µM cyt c3+ and 10 µM CcO versus 10 µM CcO before (thick line) and after 30 min reaction with 500 µM H2O2 (thin line). Measurements were done in triplicate with the nearly identical results.
Figure 7
Figure 7. Ferricytochrome c suppression of the H2O2-induced free radical EPR signal of CcO
Upper Panel: Difference EPR spectra for CcO in either the absence (solid line), or presence of 100 µM (dashed line), or 800 µM f cyt c3+ (dotted line). All samples were frozen within 10 seconds after addition of 500 µM H2O2. Each difference spectrum was calculated by subtracting the oxidized CcO spectrum from that of the H2O2 treated enzyme. Lower Panel: Dependence of the CcO radical yield upon the cyt c3+ concentration for samples reacted with H2O2 for either 10, or 100 seconds. Solid lines through each set of data are non-linear regression fits of the data to a two-term exponential decay. The reaction was initiated by addition of 500 µM H2O2 to 48.3 µM CcO solubilized in 20 mM Tris-Cl buffer, pH 7.4, containing 2 mM dodecyl maltoside and 4 mM K2SO4. Refer to Experimental Procedures for EPR experimental details. The results are presented as an average of three experiments employing two different preparations of CcO.
Figure 8
Figure 8. Decomposition of H2O2 by cyt c3+, CcO, and a mixture of cyt c and CcO
The peroxidase activity of 500 µM cyt c3+ (unfilled circles), 500 µM cyt c3+ that previously had been reacted with 10 mM KCN for 1 hour at RT (black-filled squares), 10 µM CcO (black-filled circles), and a mixture of 500 µM cyt c3+ and 10 µM CcO (grey-filled circles) were quantified by following the destruction of 500 µM H2O2 as a function of time using the FOX2 assay. The solid lines are non-linear regression fits of the cyt c3+ and CcO data to single exponentials, with second order rate constants of 5.1 M−1s−1 and 63.2 M−1s−1, respectively (the rate constant for KCN reacted cyt c3+ was essentially zero). The dot-dash line is the theoretical first order rate for a mixture of 500 µM cyt c3+ and 10 µM CcO using the two second order rate constants. All reactions were done in 20 mM Tris-Cl, pH 7.2 buffer, containing 2 mM dodecyl maltoside. The provided data are mean values of three independent experiments using three different CcO preparations and the error bars correspond to standard deviations of the measurements.

References

    1. Chance B, Williams GR. The respiratory chain and oxidative phosphorylation. Advances in Enzymol. 1956;17:65–134. - PubMed
    1. Lesnefsky EJ, Hoppel CL. Ischemia-reperfusion injury in the aged heart: role of mitochondria. Arch. Biochem. Biophys. 2003;420:287–297. - PubMed
    1. Murphy ME, Kherer JP. Oxidation state of tissue thiol groups and content of protein carbonyl groups in chickens with inherited muscular dystrophy. Biochem. J. 1989;260:359–364. - PMC - PubMed
    1. Leeuwenburgh C, Rasmussen JE, Hsu FF, Mueller DM, Pennathur S, Heinecke JW. Mass spectrometric quantification of markers for protein oxidation by tyrosyl radical, cooper, and hydroxyl radical in low density lipoprotein isolated from human atherosclerotic plaques. J. Biol. Chem. 1997;272:3520–3526. - PubMed
    1. Cohen G. Oxidative stress, mitochondrial respiration, and Parkinson’s disease. Ann. N.Y. Acad. Sci. 2000;899:112–120. - PubMed

Publication types

MeSH terms

LinkOut - more resources