

Review
doi: 10.1016/S1937-6448(10)83001-1.
Use of virtual cell in studies of cellular dynamics
Affiliations
- PMID: 20801417
- PMCID: PMC3519358
- DOI: 10.1016/S1937-6448(10)83001-1
Item in Clipboard
Review
Use of virtual cell in studies of cellular dynamics
Int Rev Cell Mol Biol.
2010.
Abstract
The Virtual Cell (VCell) is a unique computational environment for modeling and simulation of cell biology. It has been specifically designed to be a tool for a wide range of scientists, from experimental cell biologists to theoretical biophysicists. The models created with VCell can range from the simple, to evaluate hypotheses or to interpret experimental data, to complex multilayered models used to probe the predicted behavior of spatially resolved, highly nonlinear systems. In this chapter, we discuss modeling capabilities of VCell and demonstrate representative examples of the models published by the VCell users.
Copyright 2010 Elsevier Inc. All rights reserved.
Figures

Computational modeling with the VCell BioModel workspace. A set of mechanisms in Physiology generates multiple Applications, each of which in turn can spawn multiple simulations utilizing different solvers, spatial resolutions and parameter values.

A simple 2D example of handling geometry in VCell. A. Computation domain and a cell of an arbitrary shape. B. Mesh lines and grid points.

Calcium dynamics in a neuroblastoma cell: experiment and modeling

Diagram of a minimal model of nucleocytoplasmic transport.

Diagram of G-protein receptor activation.

LEGI model. A. Mechanism of perfect adaptation (for notations, see text). B. Simulated chemoattractant gradient (Application `Needle' of the public BioModel `LEGI', username `LiuYang'). C. Simulated distribution of activated PI3K induced by the chemoattractant gradient in B.

Modeling FLIP experiments. A. Diagram of the experimental setup. B. Fluorescence time courses measured in the bleached and unbleached areas. C. 3D geometry used in (43) to simulate FLIP experiments. The geometry was reconstructed in VCell from a z-stack of confocal slices. The cut shows the cell interior including the nucleus. The mask over the unbleached region, shown in black, mimics the experimental setup.
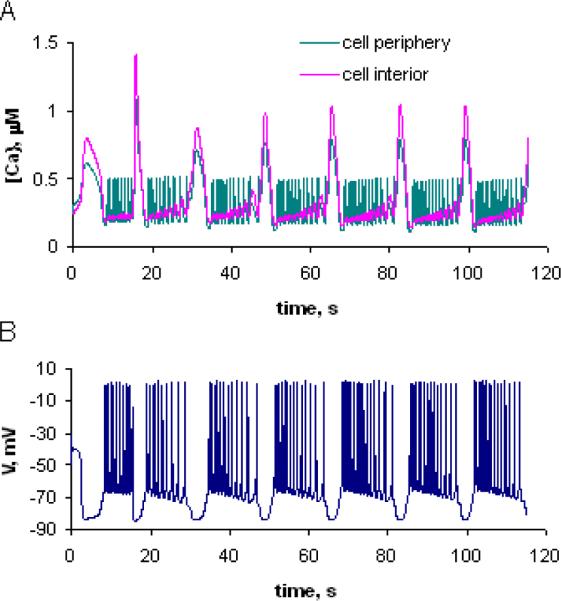
Results of a simulation of the BioModel `Gdnph-wBuffer'. A. Calcium dynamics at cell periphery (green) and cell interior (red). B. Dynamics of membrane potential.
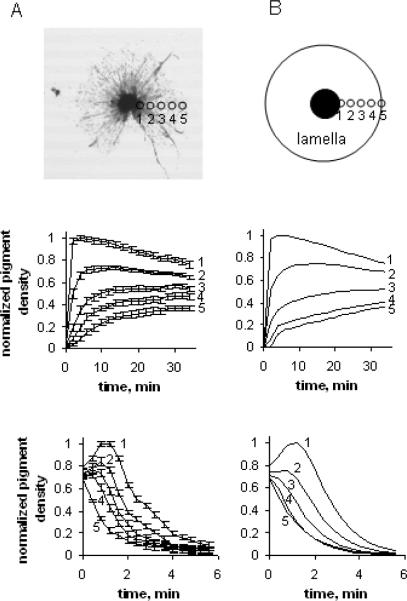
Intracellular transport of pigment granules in fish melanophores (42). A. Experiment: a snapshot of pigment aggregation (top); time courses averaged over multiple scans in several cells, shown for equidistant locations along cell “radius” during dispersion (middle) and aggregation (bottom). B. Model: idealized geometry, with the black circle mimicking the location of the pigment aggregate (top); simulated time courses of pigment density during dispersion (middle) and aggregation (bottom).

Stochastic simulations of a simple reaction network. A. Diagram of an enzymatic reaction: substrate S reversibly binds enzyme E, after which intermediate compound ES irreversibly decays into E and product P (for parameter values, see the math description in the text). B. Stochastic time course of the number of ES molecules. C. Probability distribution of the ES copy number at time t=4.0 obtained from 10000 trials.

Implementation of translation events in the BioModel workspace. The mRNA_A can be included as a catalyst (A, dashed line) or through explicit binding (B, solid lines). Both variants are equivalent but in VCell only variant B allows for the mass-action kinetic type required for stochastic simulations in the BioModel workspace.

Selected features of the actin dendritic nucleation model. (a) Surface rendering of the outer membrane of the 3D geometry used for the VCell simulations. A graded band of active NWASP on the front of the lamelipodium membrane recruits and activates Arp2/3 to initiate nucleation. (b) Simulations run to steady state produce F-actin accumulation in the lamellipodium, as shown in this plane at the bottom of the 3D geometry. The scale shows how the colors are mapped to concentrations of actin subunits within filaments. (c) Map of net polymerization and depolymerization activity in the lamellipodium of an epithelial cell derived from speckle microscopy experiments (156). Note the sharp transition between polymerization at the edge and depolymerization within 2μm of the edge (white scale bar is 5μm). (d) Simulation result for net actin polymerization rates at steady state. The white band shows a region of strong polymerization and is 2μm wide before a sharp transition to depolymerization (negative rates). Behind these two bands of activity, the bulk of the cell displays near zero actin filament assembly rates. Figure 12 c is reproduced from ….by permission of the copyright owner.
Similar articles
-
Quantitative cell biology with the Virtual Cell.Trends Cell Biol. 2003 Nov;13(11):570-6. doi: 10.1016/j.tcb.2003.09.002. Trends Cell Biol. 2003. PMID: 14573350 Review.
-
Virtual Cell: computational tools for modeling in cell biology.Wiley Interdiscip Rev Syst Biol Med. 2012 Mar-Apr;4(2):129-40. doi: 10.1002/wsbm.165. Epub 2011 Dec 2. Wiley Interdiscip Rev Syst Biol Med. 2012. PMID: 22139996 Free PMC article. Review.
-
Rule-based modeling with Virtual Cell.Bioinformatics. 2016 Sep 15;32(18):2880-2. doi: 10.1093/bioinformatics/btw353. Epub 2016 Jun 9. Bioinformatics. 2016. PMID: 27497444 Free PMC article.
-
Virtual Cell modelling and simulation software environment.IET Syst Biol. 2008 Sep;2(5):352-62. doi: 10.1049/iet-syb:20080102. IET Syst Biol. 2008. PMID: 19045830 Free PMC article.
-
Compartmental and Spatial Rule-Based Modeling with Virtual Cell.Biophys J. 2017 Oct 3;113(7):1365-1372. doi: 10.1016/j.bpj.2017.08.022. Biophys J. 2017. PMID: 28978431 Free PMC article.
Cited by
-
Developing models in virtual cell.Sci Signal. 2011 Sep 20;4(192):tr12. doi: 10.1126/scisignal.2001970. Sci Signal. 2011. PMID: 21954293 Free PMC article.
-
Ten steps to investigate a cellular system with mathematical modeling.PLoS Comput Biol. 2021 May 13;17(5):e1008921. doi: 10.1371/journal.pcbi.1008921. eCollection 2021 May. PLoS Comput Biol. 2021. PMID: 33983922 Free PMC article.
-
Redundant mechanisms for stable cell locomotion revealed by minimal models.Biophys J. 2011 Aug 3;101(3):545-53. doi: 10.1016/j.bpj.2011.06.032. Biophys J. 2011. PMID: 21806922 Free PMC article.
-
Recycling of kinesin-1 motors by diffusion after transport.PLoS One. 2013 Sep 30;8(9):e76081. doi: 10.1371/journal.pone.0076081. eCollection 2013. PLoS One. 2013. PMID: 24098765 Free PMC article.
-
Exploring the influence of cytosolic and membrane FAK activation on YAP/TAZ nuclear translocation.Biophys J. 2021 Oct 19;120(20):4360-4377. doi: 10.1016/j.bpj.2021.09.009. Epub 2021 Sep 10. Biophys J. 2021. PMID: 34509508 Free PMC article.
References
Publication types
MeSH terms
Substances
Grants and funding
LinkOut - more resources
Full Text Sources
Other Literature Sources
