. 2010 Oct;20(10):1441-50.
doi: 10.1101/gr.110114.110. Epub 2010 Aug 27.

Computational analysis of genome-wide DNA methylation during the differentiation of human embryonic stem cells along the endodermal lineage

Affiliations

Computational analysis of genome-wide DNA methylation during the differentiation of human embryonic stem cells along the endodermal lineage

Lukas Chavez et al. Genome Res. 2010 Oct.

Abstract

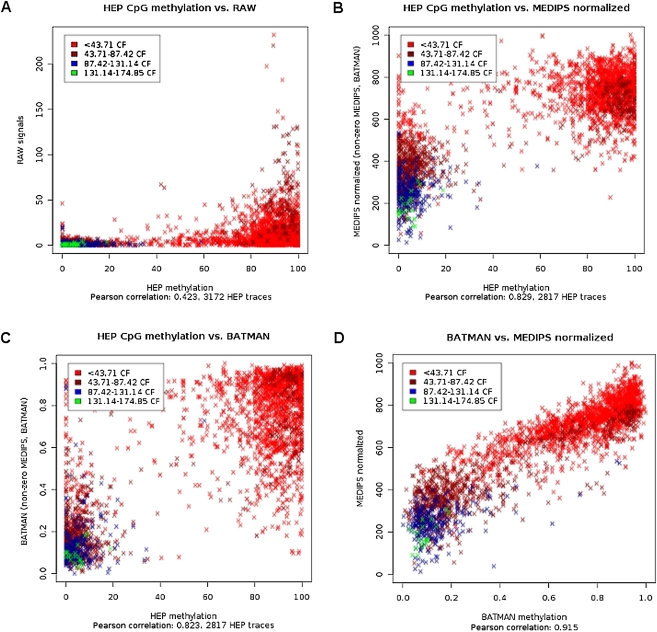
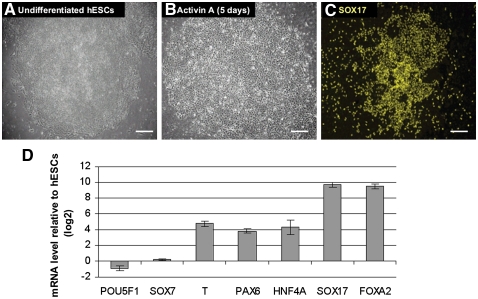
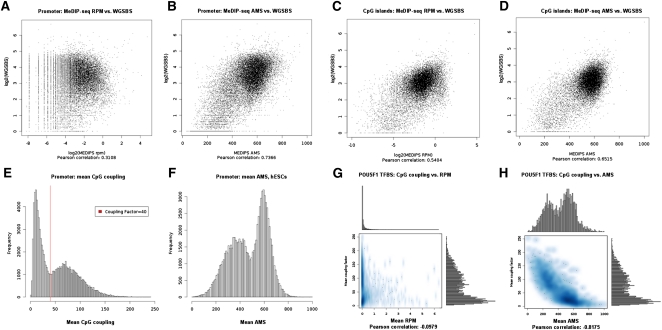
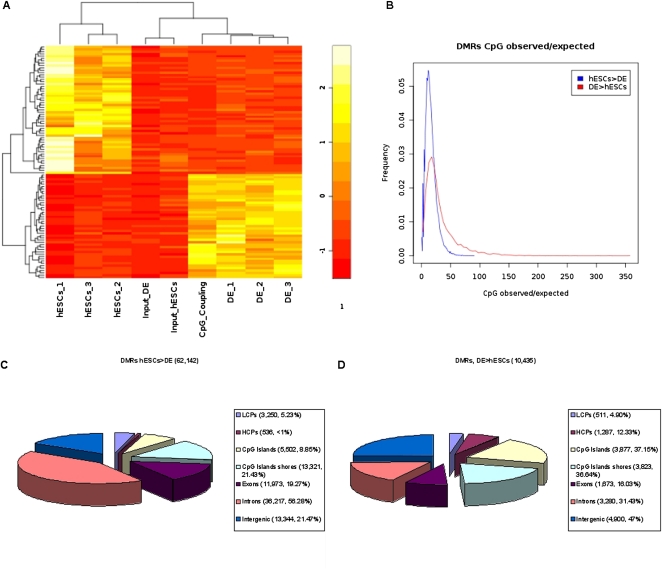
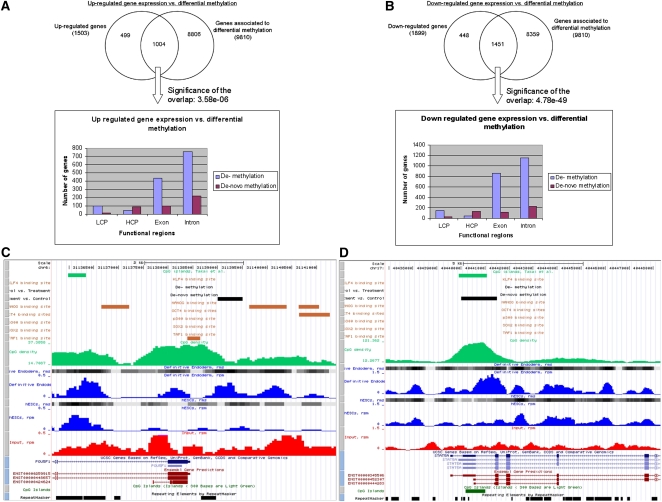
The generation of genome-wide data derived from methylated DNA immunoprecipitation followed by sequencing (MeDIP-seq) has become a major tool for epigenetic studies in health and disease. The computational analysis of such data, however, still falls short on accuracy, sensitivity, and speed. We propose a time-efficient statistical method that is able to cope with the inherent complexity of MeDIP-seq data with similar performance compared with existing methods. In order to demonstrate the computational approach, we have analyzed alterations in DNA methylation during the differentiation of human embryonic stem cells (hESCs) to definitive endoderm. We show improved correlation of normalized MeDIP-seq data in comparison to available whole-genome bisulfite sequencing data, and investigated the effect of differential methylation on gene expression. Furthermore, we analyzed the interplay between DNA methylation, histone modifications, and transcription factor binding and show that in contrast to de novo methylation, demethylation is mainly associated with regions of low CpG densities.


Figures

Figure 1.
Figure 1.
Normalization of MeDIP-seq data. We compared the normalization results of the MEDIPS method by processing publicly available MeDIP-seq data (Down et al. 2008) against bisulfite sequencing–derived methylation data from sperm samples (human epigenome project [HEP]) (Eckhardt et al. 2006). Each data point represents a genomic region analyzed by bisulfite sequencing (Eckhardt et al. 2006). The color code refers to four quantiles of the mean coupling factors (CpG densities) for these regions. Correlation plots show (A) raw MeDIP-seq signals (y-axis), (B) MEDIPS normalized signals (y-axis), and (C) Batman (Down et al. 2008) normalized (y-axis) signals against bisulfite data (x-axis) from the HEP project (Eckhardt et al. 2006). (D) Comparison of MEDIPS normalized against Batman (Down et al. 2008)-normalized MeDIP-seq data for the same genomic regions.
Figure 2.
Figure 2.
Derivation of definitive endoderm from human ES cells. Phase contrast image of undifferentiated human ES cells (hESCs; A) and cells after 5 d of Activin A treatment (B). (C) Immunofluorescence labeling of differentiated cells showing SOX17 expression. Scale bars, 100 μm. (D) Effect of Activin A treatment on the gene expression of selected genes during differentiation of human ES cells. The ratios represent the mean of two independent biological replicates. Bars, SE between the biological replicates.
Figure 3.
Figure 3.
Promoter, CpG islands, and TFBS methylation and comparison to WGSBS. (A) We divided Ensembl (Birney et al. 2004) transcript promoters of chromosome 1 into 500-bp windows and show that mean WGSBS and mean reads per million (RPM) MeDIP-seq signals have a correlation of 0.31. (B) The WGSBS vs. MeDIP-seq correlation is increased to 0.74 after MEDIPS normalization of the MeDIP-seq signals into absolute methylation signals (AMS). For CpG islands, the correlation between mean rpm MeDIP-seq and mean WGSBS values is 0.54 (C) and is increased to 0.65 after MEDIPS normalization of the MeDIP-seq signals into ams (D). (E) DNA sequences underlying human promoters show a bimodal distribution of CpG densities (calculated as means of CpG coupling factors). By setting the coupling factor = 40, we define a threshold for discriminating between low (LCPs) and high (HCPs) CpG density promoters. (F) MEDIPS normalized ams reveal the bimodal promoter methylation distributions in hESCs. (G) POU5F1 binding sites (Lister et al. 2009) show low negative correlation (−0.10) between CpG density and un-normalized rpm values in hESCs. (H) MEDIPS normalized ams values reveal the negative correlation (−0.82) between CpG density and methylation present in POU5F1 binding sites. Interestingly, mean CpG coupling factors and mean normalized ams values indicate bimodal CpG density and methylation distributions of POU5F1 TFBSs.
Figure 4.
Figure 4.
Differentially methylated regions (DMRs). (A) Heatmap of 100 DMRs, selected by highest variances between samples, including mean rpm signals for the three biological replicates of hESCs, and DE cells, the input sample from hESCs, the input sample from DE, and scaled mean CpG coupling factors. Differential methylation was calculated based on the pooled sets for hESCs, DE, and input (see Methods and Supplementary Methods). (B) Distributions of CpG observed/expected (Gardiner-Garden and Frommer 1987) ratios for demethylated regions (hESCs > DE) and de novo methylated regions (DE > hESCs). The identified demethylated (C) and de novo (D) methylated regions were annotated for Ensembl (Birney et al. 2004) transcript promoters (−2 kb to +0.5 kb regions around their TSSs; divided into LCPs and HCPs), CpG islands (Takai and Jones 2002) and their shores (−0.5 kb from the start or +0.5 kb from the end of a CpG island), exons, introns, and intergenic regions (no overlap with promoters and transcript bodies). Regions can be associated to more than one annotation (e.g., exon and CpG island).
Figure 5.
Figure 5.
Genetic and epigenetic dependencies. The figure shows the number of up-regulated (A) and down-regulated (B) genes with respect to the number of genes associated with differentially methylated regions (DMRs). For the genes that are differentially expressed and that contain a DMR, the histograms give an overview of the location of the respective demethylated and de novo methylated regions (LCP indicates low CpG density promotor; HCP, high CpG density promotor). (C) The promoter region of the down-regulated TF POU5F1, including an identified promoter de novo methylation event. (D) The promoter region of the down-regulated TF, STAT5A, including an identified de novo methylation event. Visualization of both regions was done with a local copy of the UCSC Genome Browser (Kuhn et al. 2009) (hg19). Included tracks are rpm (blue curves) and rms (gray blocks) values for hESCs and DE, rpm values for input (red curves), demethylated and de novo methylated regions (black blocks), CpG islands defined by UCSC (dark green blocks at the bottom) (Kuhn et al. 2009) and by Takai and Jones (2002) (light green blocks at the top), CpG densities along the chromosome (green curves, calculated by MEDIPS based on the CpG coupling factors), TFBSs of six TFs (orange blocks; genomic regions were transformed from hg18 to hg19 using UCSCs liftOver software; Rhead et al. 2010) (Lister et al. 2009), repeat masked regions (black boxes at the bottom), and RefSeq (Pruitt et al. 2007) and Ensembl (Birney et al. 2004) transcripts.

References

    1. Agarwal S, Holton KL, Lanza R 2008. Efficient differentiation of functional hepatocytes from human embryonic stem cells. Stem Cells 26: 1117–1127 - PubMed
    1. Altun G, Loring JF, Laurent LC 2010. DNA methylation in embryonic stem cells. J Cell Biochem 109: 1–6 - PMC - PubMed
    1. Barski A, Cuddapah S, Cui K, Roh TY, Schones DE, Wang Z, Wei G, Chepelev I, Zhao K 2007. High-resolution profiling of histone methylations in the human genome. Cell 129: 823–837 - PubMed
    1. Birney E, Andrews TD, Bevan P, Caccamo M, Chen Y, Clarke L, Coates G, Cuff J, Curwen V, Cutts T, et al. 2004. An overview of Ensembl. Genome Res 14: 925–928 - PMC - PubMed
    1. Bock C, Halachev K, Buch J, Lengauer T 2009. EpiGRAPH: User-friendly software for statistical analysis and prediction of (epi)genomic data. Genome Biol 10: R14 doi: 10.1186/gb-2009-10-2-r14 - PMC - PubMed

Publication types

Associated data