

Complex structure of electrophysiological gradients emerging during long-duration ventricular fibrillation in the canine heart
- PMID: 20802138
- PMCID: PMC2993199
- DOI: 10.1152/ajpheart.00419.2010
Complex structure of electrophysiological gradients emerging during long-duration ventricular fibrillation in the canine heart
Abstract
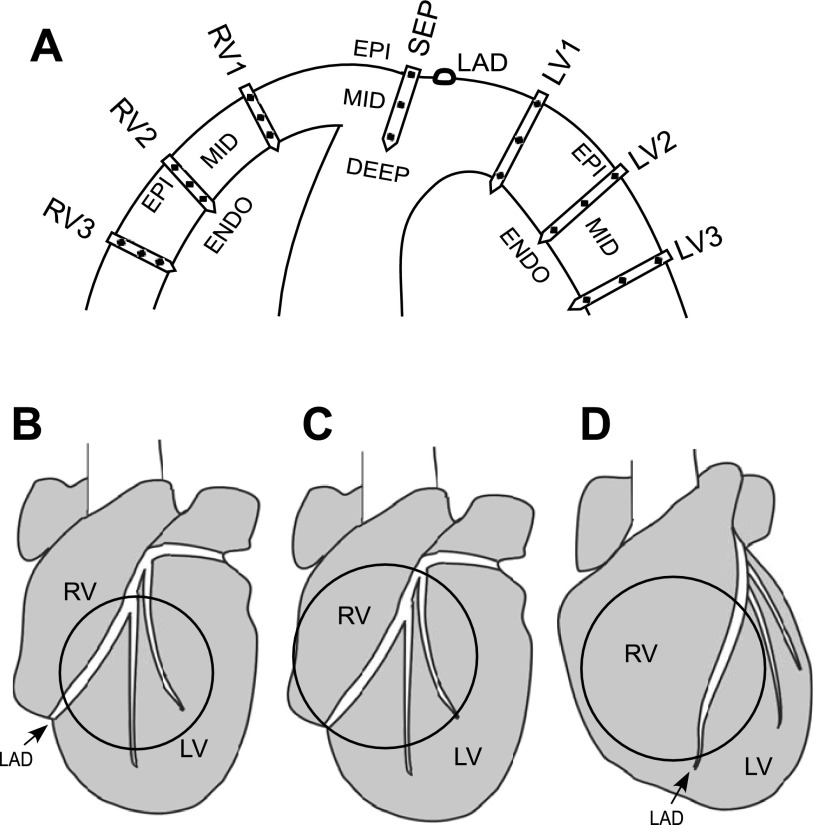
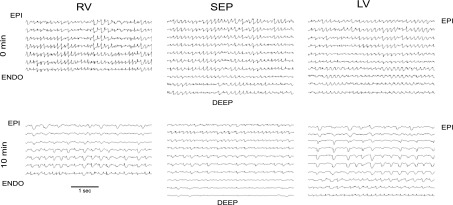
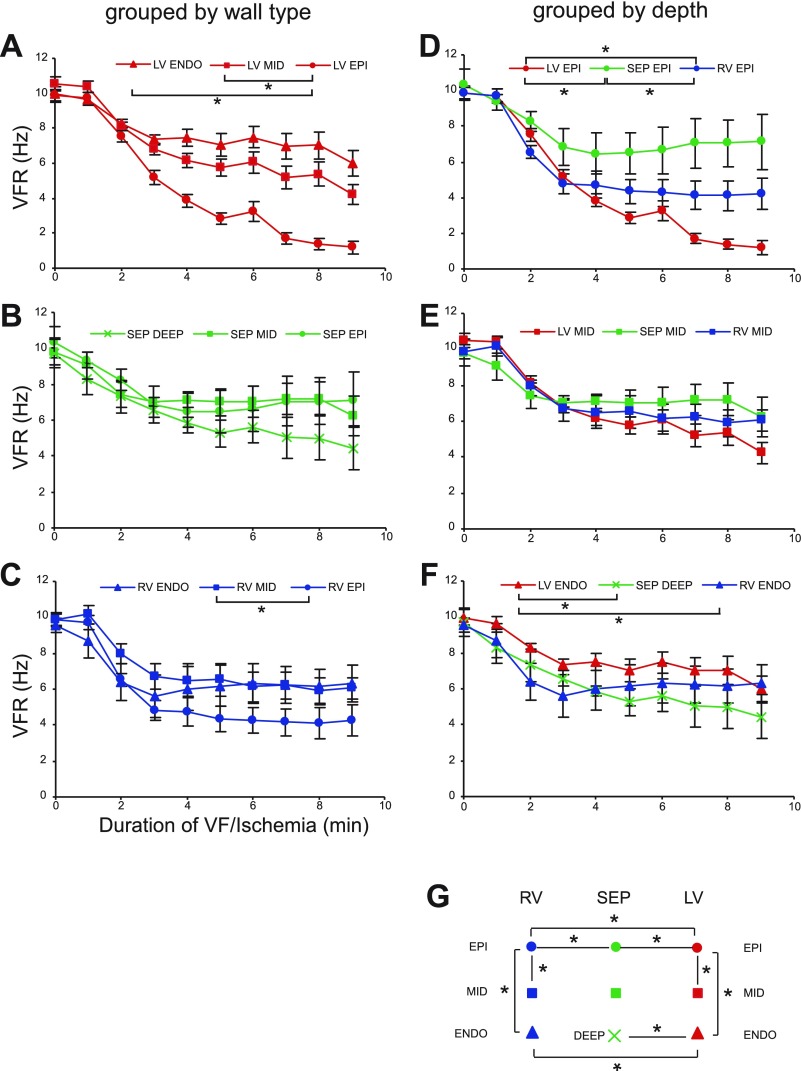
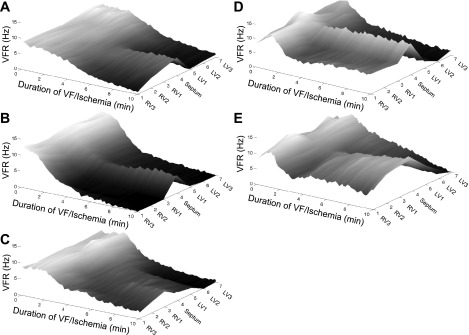
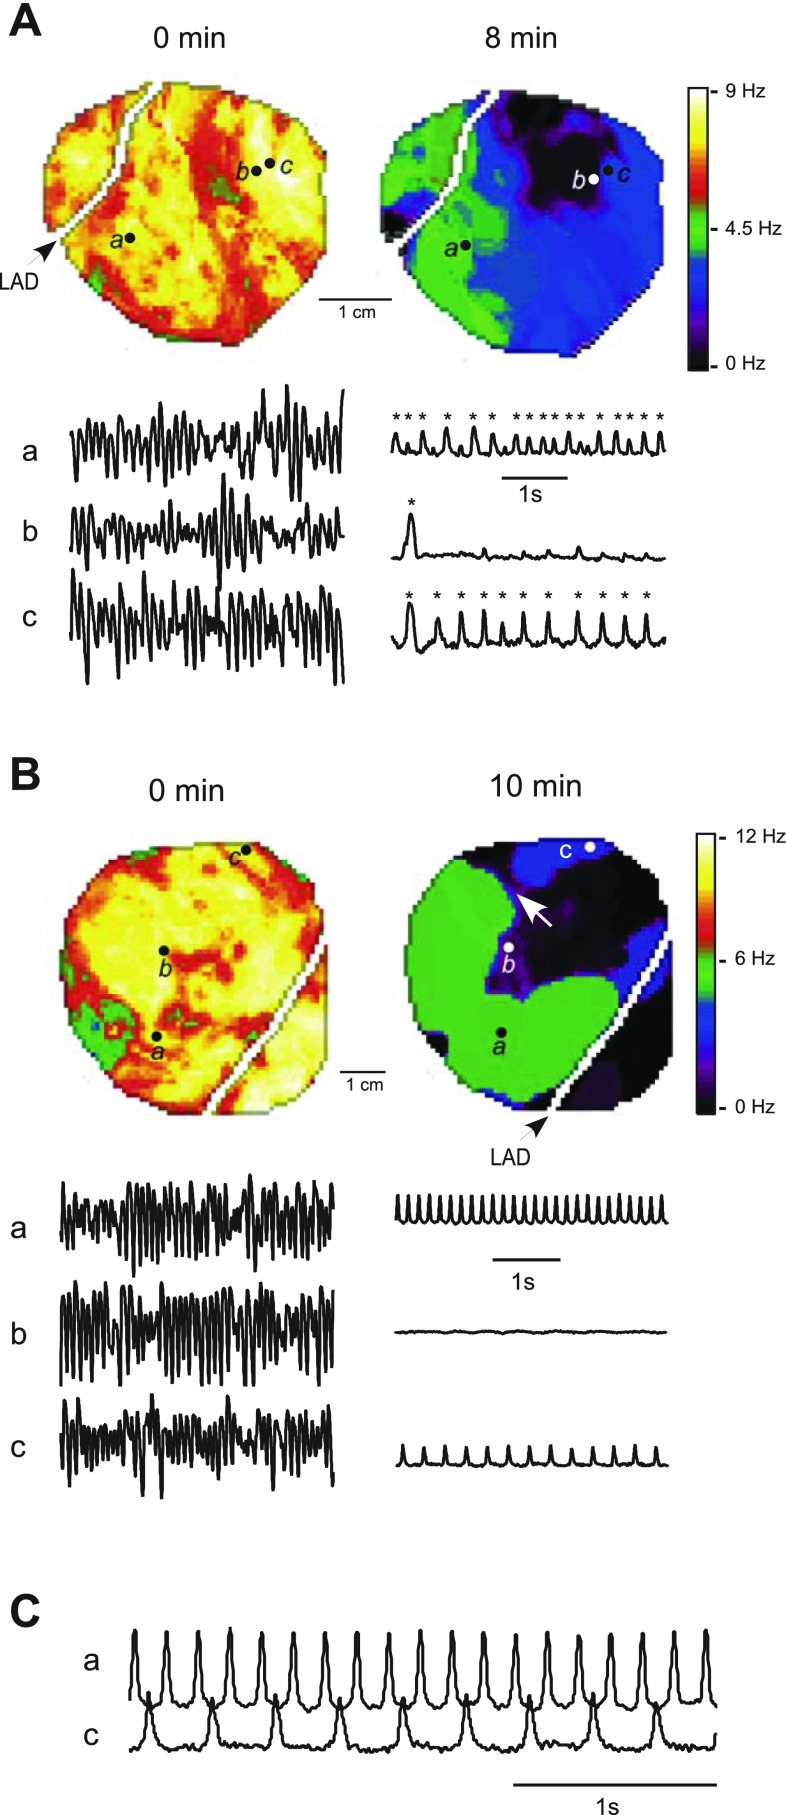
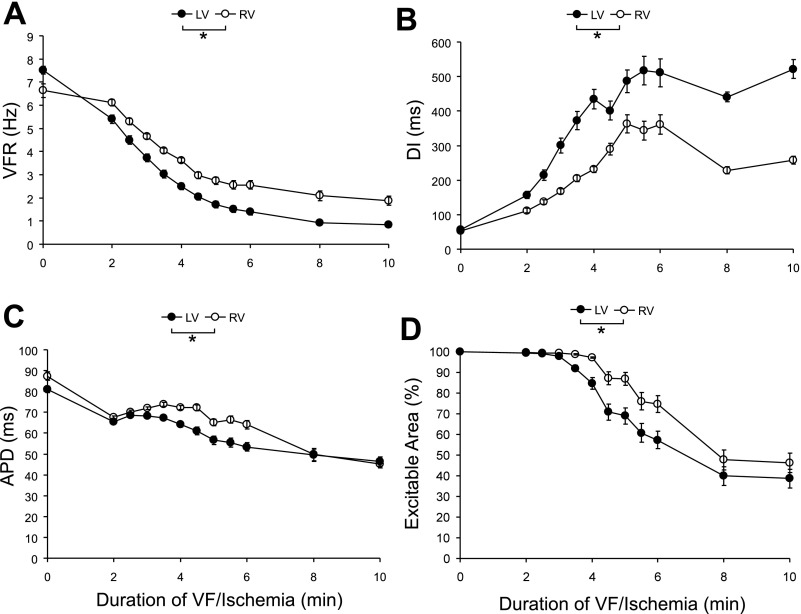
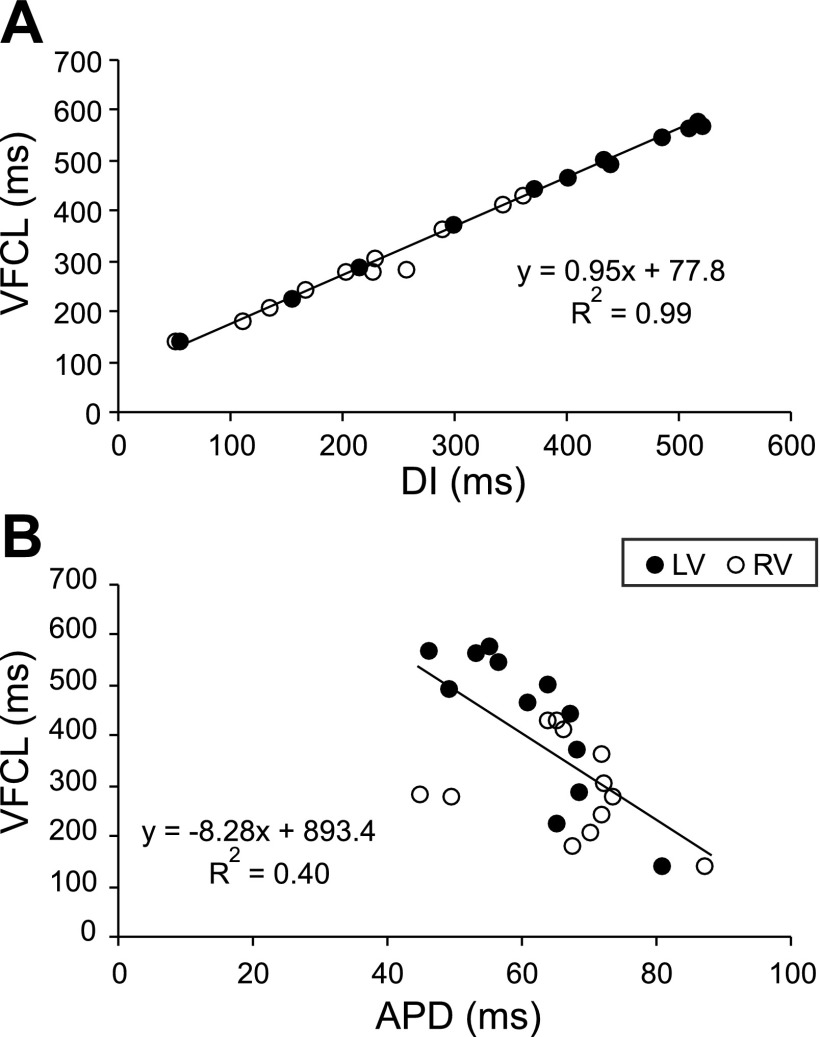
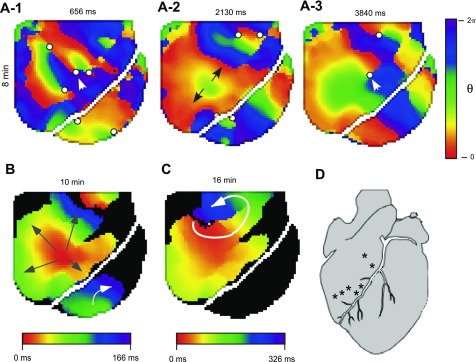
Long-duration ventricular fibrillation (LDVF) in the globally ischemic heart is a common setting of cardiac arrest. Electrical heterogeneities during LDVF may affect outcomes of defibrillation and resuscitation. Previous studies in large mammalian hearts have investigated the role of Purkinje fibers and electrophysiological gradients between the endocardium (Endo) and epicardium (Epi). Much less is known about gradients between the right ventricle (RV) and left ventricle (LV) and within each chamber during LDVF. We studied the transmural distribution of the VF activation rate (VFR) in the RV and LV and at the junction of RV, LV, and septum (Sep) during LDVF using plunge needle electrodes in opened-chest dogs. We also used optical mapping to analyze the Epi distribution of VFR, action potential duration (APD), and diastolic interval (DI) during LDVF in the RV and LV of isolated hearts. Transmural VFR gradients developed in both the RV and LV, with a faster VFR in Endo. Concurrently, large VFR gradients developed in Epi, with the fastest VFR in the RV-Sep junction, intermediate in the RV, and slowest in the LV. Optical mapping revealed a progressively increasing VFR dispersion within both the LV and RV, with a mosaic presence of fully inexcitable areas after 4-8 min of LDVF. The transmural, interchamber, and intrachamber VFR heterogeneities were of similar magnitude. In both chambers, the inverse of VFR was highly correlated with DI, but not APD, at all time points of LDVF. We conclude that the complex VFR gradients during LDVF in the canine heart cannot be explained solely by the distribution of Purkinje fibers and are related to regional differences in the electrical depression secondary to LDVF.
Figures
Similar articles
-
Global Bi-ventricular endocardial distribution of activation rate during long duration ventricular fibrillation in normal and heart failure canines.BMC Cardiovasc Disord. 2017 Apr 13;17(1):99. doi: 10.1186/s12872-017-0530-5. BMC Cardiovasc Disord. 2017. PMID: 28407744 Free PMC article.
-
Role of KATP channel in electrical depression and asystole during long-duration ventricular fibrillation in ex vivo canine heart.Am J Physiol Heart Circ Physiol. 2012 Jun 1;302(11):H2396-409. doi: 10.1152/ajpheart.00752.2011. Epub 2012 Mar 30. Am J Physiol Heart Circ Physiol. 2012. PMID: 22467302 Free PMC article.
-
Chemical ablation of the Purkinje system causes early termination and activation rate slowing of long-duration ventricular fibrillation in dogs.Am J Physiol Heart Circ Physiol. 2008 Aug;295(2):H883-9. doi: 10.1152/ajpheart.00466.2008. Epub 2008 Jun 27. Am J Physiol Heart Circ Physiol. 2008. PMID: 18586887 Free PMC article.
-
Our search for the porcine mother rotor.Ann Noninvasive Electrocardiol. 2005 Oct;10(4 Suppl):7-15. doi: 10.1111/j.1542-474X.2005.00071.x. Ann Noninvasive Electrocardiol. 2005. PMID: 16274411 Free PMC article. Review.
-
Transmural dispersion of repolarization and arrhythmogenicity: the Brugada syndrome versus the long QT syndrome.J Electrocardiol. 1999;32 Suppl:158-65. doi: 10.1016/s0022-0736(99)90074-2. J Electrocardiol. 1999. PMID: 10688320 Review.
Cited by
-
Endocardial Activation Drives Activation Patterns During Long-Duration Ventricular Fibrillation and Defibrillation.Circ Arrhythm Electrophysiol. 2017 Dec;10(12):e005562. doi: 10.1161/CIRCEP.117.005562. Circ Arrhythm Electrophysiol. 2017. PMID: 29247031 Free PMC article.
-
Metabolic determinants of electrical failure in ex-vivo canine model of cardiac arrest: evidence for the protective role of inorganic pyrophosphate.PLoS One. 2013;8(3):e57821. doi: 10.1371/journal.pone.0057821. Epub 2013 Mar 8. PLoS One. 2013. PMID: 23520482 Free PMC article.
-
Mitochondrial depolarization and asystole in the globally ischemic rabbit heart: coordinated response to interventions affecting energy balance.Am J Physiol Heart Circ Physiol. 2015 Mar 1;308(5):H485-99. doi: 10.1152/ajpheart.00257.2014. Epub 2014 Dec 30. Am J Physiol Heart Circ Physiol. 2015. PMID: 25552307 Free PMC article.
-
Does the combination of hyperkalemia and KATP activation determine excitation rate gradient and electrical failure in the globally ischemic fibrillating heart?Am J Physiol Heart Circ Physiol. 2013 Sep 15;305(6):H903-12. doi: 10.1152/ajpheart.00184.2013. Epub 2013 Jul 19. Am J Physiol Heart Circ Physiol. 2013. PMID: 23873793 Free PMC article.
-
Optical mapping of the pig heart in situ under artificial blood circulation.Sci Rep. 2020 May 22;10(1):8548. doi: 10.1038/s41598-020-65464-5. Sci Rep. 2020. PMID: 32444634 Free PMC article.
References
-
- Allison JS, Qin H, Dosdall DJ, Huang J, Newton JC, Allred JD, Smith WM, Ideker RE. The transmural activation sequence in porcine and canine left ventricle is markedly different during long-duration ventricular fibrillation. J Cardiovasc Electrophysiol 18: 1306–1312, 2007. - PubMed
-
- Antzelevitch C, Sicouri S, Litovsky SH, Lukas A, Krishnan SC, Di Diego JM, Gintant GA, Liu DW. Heterogeneity within the ventricular wall. Electrophysiology and pharmacology of epicardial, endocardial, and M cells. Circ Res 69: 1427–1449, 1991. - PubMed
-
- Caldwell J, Burton FL, Smith GL, Cobbe SM. Heterogeneity of ventricular fibrillation dominant frequency during global ischemia in isolated rabbit hearts. J Cardiovasc Electrophysiol 18: 854–861, 2007. - PubMed
-
- Cha YM, Uchida T, Wolf PL, Peters BB, Fishbein MC, Karagueuzian HS, Chen PS. Effects of chemical subendocardial ablation on activation rate gradient during ventricular fibrillation. Am J Physiol Heart Circ Physiol 269: H1998–H2009, 1995. - PubMed
Publication types
MeSH terms
Grants and funding
LinkOut - more resources
Full Text Sources