. 2010 Oct;177(4):1977-88.
doi: 10.2353/ajpath.2010.100346. Epub 2010 Aug 27.

A{beta} accelerates the spatiotemporal progression of tau pathology and augments tau amyloidosis in an Alzheimer mouse model

Affiliations

A{beta} accelerates the spatiotemporal progression of tau pathology and augments tau amyloidosis in an Alzheimer mouse model

David E Hurtado et al. Am J Pathol. 2010 Oct.

Abstract

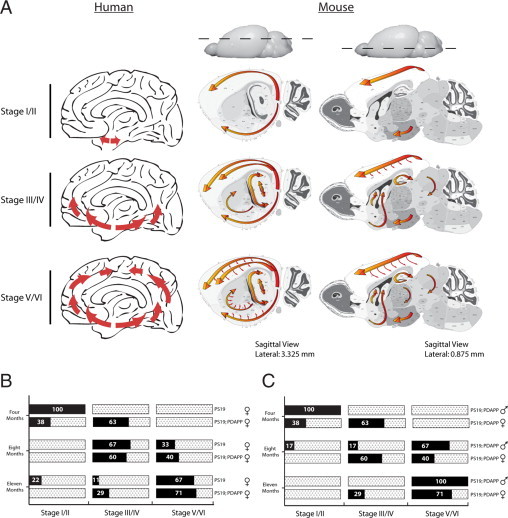
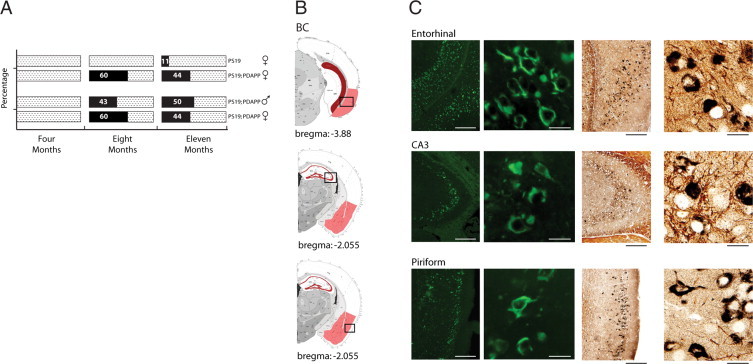
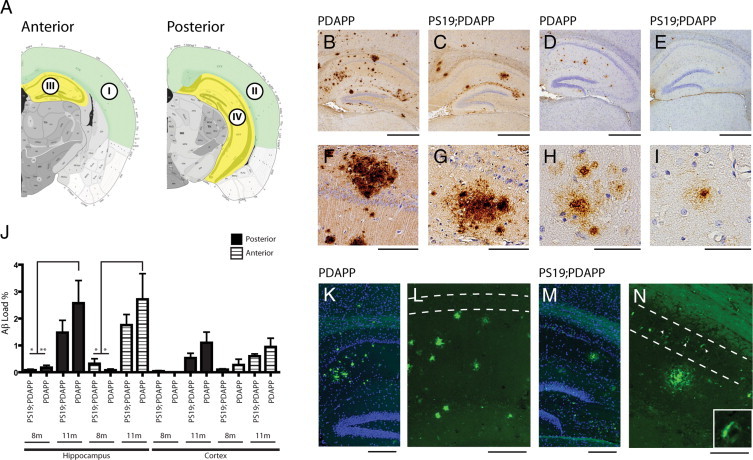
Senile plaques formed by β-amyloid peptides (Aβ) and neurofibrillary tangles (NFTs) formed by hyperphosphorylated tau, a microtubule-associated protein, are the hallmark lesions of Alzheimer's disease (AD) in addition to loss of neurons. While several transgenic (Tg) mouse models have recapitulated aspects of AD-like Aβ and tau pathologies, a spatiotemporal mapping paradigm for progressive NFT accumulation is urgently needed to stage disease progression in AD mouse models. Braak and co-workers developed an effective and widely used NFT staging paradigm for human AD brains. The creation of a Braak-like spatiotemporal staging scheme for tau pathology in mouse models would facilitate mechanistic studies of AD-like tau pathology. Such a scheme would also enhance the reproducibility of preclinical AD therapeutic studies. Thus, we developed a novel murine model of Aβ and tau pathologies and devised a spatiotemporal scheme to stage the emergence and accumulation of NFTs with advancing age. Notably, the development of NFTs followed a spatiotemporal Braak-like pattern similar to that observed in authentic AD. More significantly, the presence of Aβ accelerated NFT formation and enhanced tau amyloidosis; however, tau pathology did not have the same effect on Aβ pathology. This novel NFT staging scheme provides new insights into the mechanisms of tau pathobiology, and we speculate that this scheme will prove useful for other basic and translational studies of AD mouse models.


Figures

Figure 1
Figure 1
Schematic representation of bregma regions analyzed for staging tau progression. A: Sagittal view of mouse brain indicating the approximate positions of coronal slices generated at 2-mm intervals as indicated by dashed blue lines. Red shaded area indicates structural span analyzed for current study. B: Coronal views of the three bregma regions used for staging tau progression. Mouse illustrations in this and other figures are adapted from the Allen Mouse Brain Atlas (see http://mouse.brain-map.org).
Figure 2
Figure 2
Accelerated motor phenotypes in bigenic PS19;PDAPP mice with reductions in body weight. A: Cross-sectional body weights of WT, PDAPP, PS19, and PS19;PDAPP Tg female mice at 4 and 11 months of age. Bigenic PS19;PDAPP display a more consistent reduction in body weight when compared with monogenic PS19 mice. Additionally, WT and PDAPP mice display significant increases in body weight (*P < 0.05) with age as expected. n = 18 for wild type, n = 5–9 for PDAPP, n = 7–8 for PS19, n = 8–9 for PS19;PDAPP. B: Percentage of female Tg mice displaying motor phenotypes that include paresis, paralysis, and hunchback posture. Mice that display any of these three phenotypes were given a score of 1, whereas mice lacking all three phenotypes were scored as 0. Pie chart represents percentage of mice with a motor score of 1 over two time points (4 and 11 months) and between two Tg mice, that is, PS19, and PS19;PDAPP. n = 9 for PS19, n = 8–9 for PS19;PDAPP. C and D: Comparisons of male and female bigenic PS19;PDAPP mice by cross-sectional body weight (C) and motor phenotype (D) at 4 and 11 months of age. Bigenic male mice display larger decreases in body weight and greater percentages of mice with a motor phenotype. n = 6–8 for PS19;PDAPP males, n = 8–9 for PS19;PDAPP females. E and F: Kaplan–Meier Survival Curves comparing female (E) and male (F) PS19 and bigenic PS19;PDAPP mice. Bigenic mice demonstrate a statistically significant (P = 0.0492) increase in premature death rate with a median survival of 12 months for females (versus 13 months for female PS19 monogenic) and 10 months for males (versus 11 months for male PS19 monogenic). Between male and female bigenic mice, males showed a statistically significant increase in premature death as shown in F (P = 0.0211). n = 32 for PS19 females, n = 44 for PS19 males, n = 24 for PS19;PDAPP females, n = 35 for PS19;PDAPP males.
Figure 3
Figure 3
Six stages of AT8 spatial distribution. A: Representative images of six distinct mice, each with a unique stage from I-VI, immunostained with AT8. Each column is an individual mouse while each row is a defined bregma. B: Higher magnification images of Stages II, IV, and VI of the hippocampal column at bregma −2.055 mm, demonstrating progressive tau pathology (calibration bars = 200 mm).
Figure 4
Figure 4
Comparison of Braak staging neurofibrillary changes to murine AT8 pTau-ir. A: Distribution of neurofibrillary development in Alzheimer's pathology and murine staging. Sagittal view of human and mouse brains, with red arrows indicating progression of neurofibrillary changes. Each row indicates defined stages I/II, III/IV, and V/VI. Human pathology initiates in the entorhinal cortex (Stage I/II), then proceeds into the hippocampal formation (HPF) and temporal cortex (Stage III/IV), and finally involves the neocortex (Stage V/VI). Similarly, murine staging begins in the entorhinal cortex with sporadic appearance within layers 2/3 of the neocortex (Stage I/II), which progresses into the HPF and further into the neocortical layers (Stage III/IV), and finally widespread development of pTau-ir in the straitum, thalamus, and deep layers of the neocortex (Stage V/VI). Note: Olfactory bulb, brainstem, and cerebellum were not scored in this study and are therefore not depicted to show pTau-ir. B: Mice at 4, 8, and 11 months of age were scored at bregmas 0.145, −2.055, and −2.88, which resulted in a staging category of I/II, III/IV, and V/VI, respectively. The graph illustrates the percentage of mice that are within a specific staging category (x axis) over a 4-, 8-, and 11-month time point (y axis, left) and within a given genotype (y axis, right). Female mice PS19 versus PS19;PDAPP are shown in B, and males versus female PS19;PDAPP are shown in C.
Figure 5
Figure 5
Accelerated neurofibrillary tangle formation in bigenic mice. A: PS19 and PS19; PDAPP Tg mice were stained with ThS and analyzed for NFT formation. The percentage of mice displaying positive ThS staining was plotted over a 4-, 8-, and 11-month time course. Comparison of ThS-positive tangles between male and female PS19;PDAPP Tg mice over a 4-, 8-, and 11-month time course demonstrates a consistent increase in tangle formation regardless of sex. B: Graphical illustration of ThS-positive deposits throughout the mouse brain. Red colorization indicates the presence of ThS-positive tangles. Black boxes correspond to photographic images immediately adjacent to illustration. C: Representative photographic images of ThS and Gallyas Silver staining in entorhinal, CA3, and piriform regions. Calibration bars (ThS and Gallyas Silver): low magnification 200 mm, high magnification 20 mm).
Figure 6
Figure 6
Quantitative analyses of hippocampal and cortical plaque deposition. A: Illustrative depiction of areas analyzed for Aβ load. Anterior and posterior cortical regions are highlighted in green, while anterior and posterior hippocampus regions are highlighted in yellow. Roman numerals designate ROI I–IV. B–I: Brain sections of 11-month-old monogenic PDAPP and bigenic PS19;PDAPP female mice stained with Nab228 (B, C, F, and G), Nab61 (D, E, H, and I), and Thioflavine-S (ThS) (K–N). B and C compares Nab228 staining between PDAPP and PS19;PDAPP, which highlights a tendency for increased Aβ deposits in monogenic PDAPP Tg mice. F and G are higher magnifications of B and C, respectively (Calibration bars: low magnification 0.5 mm, high magnification 100 mm). D and E compare Nab61 staining between PDAPP and PS19;PDAPP mice, demonstrating the low occurrence of mature senile plaques. H and I are higher magnifications of D and E, respectively (Calibration bars: low magnification 0.5 mm, high magnification 50 mm). J: Sections stained with Nab228 and ROI threshold was determined using ImageJ software and graphically represented as a percentage of Aβ load over a given area of ROI. In both PDAPP and PS19;PDAPP Tg mice, an increasing plaque burden is evident with increasing age, which is more predominant in monogenic PDAPP Tg mice within the hippocampal regions. Data were analyzed by analysis of variance and error bars as SEM (*P < 0.01, **P < 0.05). n = 5–9 for PS19 at 8 and 11 months, n = 4–7 for PS19;PDAPP at 8 and 11 months. K and M are ThS staining in PDAPP and PS19;PDAPP, respectively. ThS and DAPI images were overlaid to demonstrate the spatial distribution of plaque deposition within the hippocampus. L and N are ThS images of panels K and M, respectively. White dashed lines denotes CA1 regions of the hippocampus; in L, there is a lack of ThS-positive NFT, while in N, several ThS-positive NFTs are observed (arrowheads) within the CA1 region. Inset in N is higher magnification of ThS-positive NFTs found in the CA1 region. Calibration bars: 200 mm (K and M); 100 mm (L and N).

Comment in

Similar articles

Cited by

References

    1. Braak H, Braak E. Staging of Alzheimer's disease-related neurofibrillary changes. Neurobiol Aging. 1995;16:271–278. - PubMed
    1. Bondareff W, Mountjoy CQ, Roth M, Hauser DL. Neurofibrillary degeneration and neuronal loss in Alzheimer's disease. Neurobiol Aging. 1989;10:709–715. - PubMed
    1. Gomez-Isla T, Hollister R, West H, Mui S, Growdon JH, Petersen RC, Parisi JE, Hyman BT. Neuronal loss correlates with but exceeds neurofibrillary tangles in Alzheimer's disease. Ann Neurol. 1997;41:17–24. - PubMed
    1. Braak H, Braak E. Frequency of stages of Alzheimer-related lesions in different age categories. Neurobiol Aging. 1997;18:351–357. - PubMed
    1. Schonheit B, Zarski R, Ohm TG. Spatial and temporal relationships between plaques and tangles in Alzheimer-pathology. Neurobiol Aging. 2004;25:697–711. - PubMed

Publication types

MeSH terms