

Genetic variation influences glutamate concentrations in brains of patients with multiple sclerosis
- PMID: 20802204
- PMCID: PMC2929334
- DOI: 10.1093/brain/awq192
Genetic variation influences glutamate concentrations in brains of patients with multiple sclerosis
Abstract
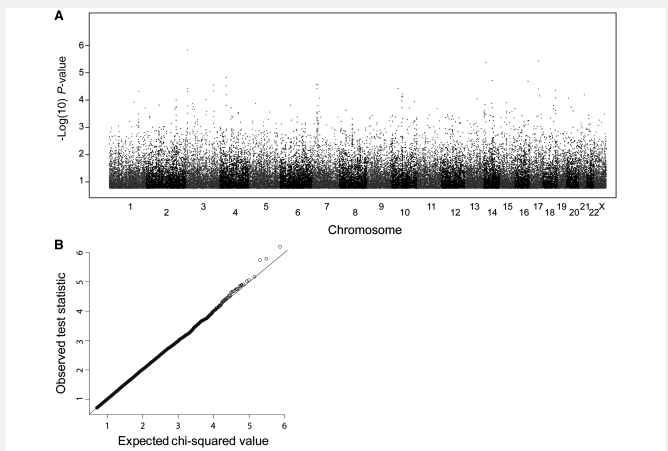
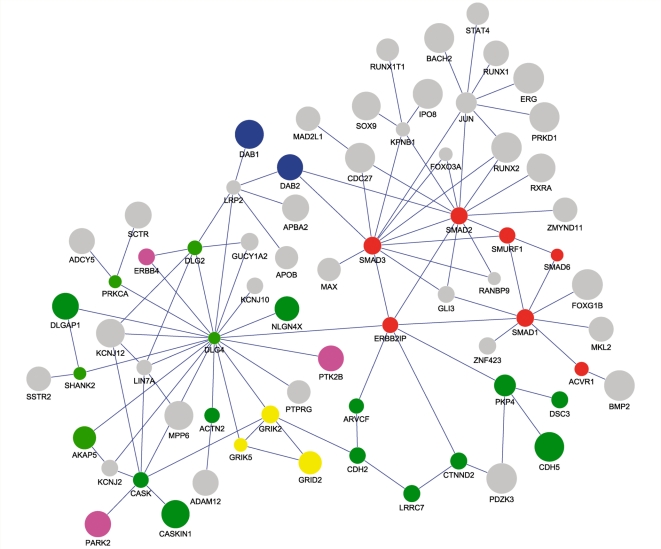
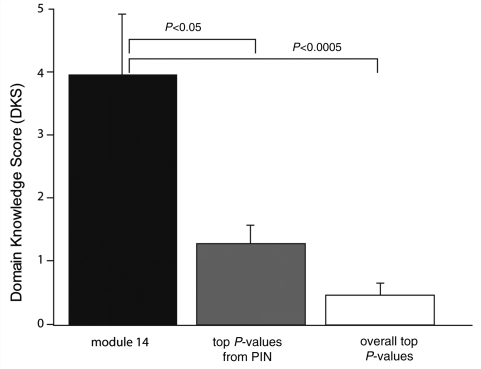
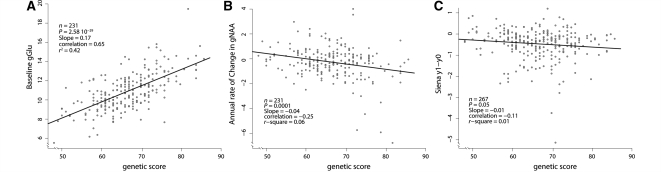
Glutamate is the main excitatory neurotransmitter in the mammalian brain. Appropriate transmission of nerve impulses through glutamatergic synapses is required throughout the brain and forms the basis of many processes including learning and memory. However, abnormally high levels of extracellular brain glutamate can lead to neuroaxonal cell death. We have previously reported elevated glutamate levels in the brains of patients suffering from multiple sclerosis. Here two complementary analyses to assess the extent of genomic control over glutamate levels were used. First, a genome-wide association analysis in 382 patients with multiple sclerosis using brain glutamate concentration as a quantitative trait was conducted. In a second approach, a protein interaction network was used to find associated genes within the same pathway. The top associated marker was rs794185 (P < 6.44 x 10(-7)), a non-coding single nucleotide polymorphism within the gene sulphatase modifying factor 1. Our pathway approach identified a module composed of 70 genes with high relevance to glutamate biology. Individuals carrying a higher number of associated alleles from genes in this module showed the highest levels of glutamate. These individuals also showed greater decreases in N-acetylaspartate and in brain volume over 1 year of follow-up. Patients were then stratified by the amount of annual brain volume loss and the same approach was performed in the 'high' (n = 250) and 'low' (n = 132) neurodegeneration groups. The association with rs794185 was highly significant in the group with high neurodegeneration. Further, results from the network-based pathway analysis remained largely unchanged even after stratification. Results from these analyses indicated that variance in the activity of neurochemical pathways implicated in neurodegeneration is explained, at least in part, by the inheritance of common genetic polymorphisms. Spectroscopy-based imaging provides a novel quantitative endophenotype for genetic association studies directed towards identifying new factors that contribute to the heterogeneity of clinical expression of multiple sclerosis.
Figures
Similar articles
-
A genome-wide association study of brain lesion distribution in multiple sclerosis.Brain. 2013 Apr;136(Pt 4):1012-24. doi: 10.1093/brain/aws363. Epub 2013 Feb 13. Brain. 2013. PMID: 23412934 Free PMC article.
-
Evidence for early neurodegeneration in the cervical cord of patients with primary progressive multiple sclerosis.Brain. 2015 Jun;138(Pt 6):1568-82. doi: 10.1093/brain/awv086. Epub 2015 Apr 10. Brain. 2015. PMID: 25863355 Free PMC article.
-
Glutamate concentrations in human brain using single voxel proton magnetic resonance spectroscopy at 3 Tesla.Neuroimage. 2004 Apr;21(4):1762-71. doi: 10.1016/j.neuroimage.2003.11.014. Neuroimage. 2004. PMID: 15050596
-
Glutamate, T cells and multiple sclerosis.J Neural Transm (Vienna). 2017 Jul;124(7):775-798. doi: 10.1007/s00702-016-1661-z. Epub 2017 Feb 24. J Neural Transm (Vienna). 2017. PMID: 28236206 Review.
-
Multiple sclerosis genetics.Lancet Neurol. 2014 Jul;13(7):700-9. doi: 10.1016/S1474-4422(14)70041-9. Epub 2014 May 19. Lancet Neurol. 2014. PMID: 24852507 Review.
Cited by
-
The value of regenotyping older linkage data sets with denser marker panels.Hum Hered. 2014;78(1):9-16. doi: 10.1159/000360003. Epub 2014 Jun 21. Hum Hered. 2014. PMID: 24969307 Free PMC article.
-
Loci associated with N-glycosylation of human immunoglobulin G show pleiotropy with autoimmune diseases and haematological cancers.PLoS Genet. 2013;9(1):e1003225. doi: 10.1371/journal.pgen.1003225. Epub 2013 Jan 31. PLoS Genet. 2013. PMID: 23382691 Free PMC article.
-
Inhibition of glutamate carboxypeptidase II (GCPII) activity as a treatment for cognitive impairment in multiple sclerosis.Proc Natl Acad Sci U S A. 2012 Dec 4;109(49):20101-6. doi: 10.1073/pnas.1209934109. Epub 2012 Nov 19. Proc Natl Acad Sci U S A. 2012. PMID: 23169655 Free PMC article.
-
Ca2+ Signaling Augmented by ORAI1 Trafficking Regulates the Pathogenic State of Effector T Cells.J Immunol. 2022 Mar 15;208(6):1329-1340. doi: 10.4049/jimmunol.2100871. Epub 2022 Feb 25. J Immunol. 2022. PMID: 35217583 Free PMC article.
-
Pathways to neurodegeneration: mechanistic insights from GWAS in Alzheimer's disease, Parkinson's disease, and related disorders.Am J Neurodegener Dis. 2013 Sep 18;2(3):145-75. Am J Neurodegener Dis. 2013. PMID: 24093081 Free PMC article. Review.
References
-
- ANZgene. Genome-wide association study identifies new multiple sclerosis susceptibility loci on chromosomes 12 and 20. Nat Genet. 2009;41:824–8. - PubMed
-
- Clinton SM, Meador-Woodruff JH. Abnormalities of the NMDA receptor and associated intracellular molecules in the thalamus in schizophrenia and bipolar disorder. Neuropsychopharmacology. 2004;29:1353–62. - PubMed
-
- Cowley AW., Jr The genetic dissection of essential hypertension. Nat Rev Genet. 2006;7:829–40. - PubMed
Publication types
MeSH terms
Substances
Grants and funding
LinkOut - more resources
Full Text Sources
Medical
