

MapSplice: accurate mapping of RNA-seq reads for splice junction discovery
- PMID: 20802226
- PMCID: PMC2952873
- DOI: 10.1093/nar/gkq622
MapSplice: accurate mapping of RNA-seq reads for splice junction discovery
Abstract
The accurate mapping of reads that span splice junctions is a critical component of all analytic techniques that work with RNA-seq data. We introduce a second generation splice detection algorithm, MapSplice, whose focus is high sensitivity and specificity in the detection of splices as well as CPU and memory efficiency. MapSplice can be applied to both short (<75 bp) and long reads (≥ 75 bp). MapSplice is not dependent on splice site features or intron length, consequently it can detect novel canonical as well as non-canonical splices. MapSplice leverages the quality and diversity of read alignments of a given splice to increase accuracy. We demonstrate that MapSplice achieves higher sensitivity and specificity than TopHat and SpliceMap on a set of simulated RNA-seq data. Experimental studies also support the accuracy of the algorithm. Splice junctions derived from eight breast cancer RNA-seq datasets recapitulated the extensiveness of alternative splicing on a global level as well as the differences between molecular subtypes of breast cancer. These combined results indicate that MapSplice is a highly accurate algorithm for the alignment of RNA-seq reads to splice junctions. Software download URL: http://www.netlab.uky.edu/p/bioinfo/MapSplice.
Figures
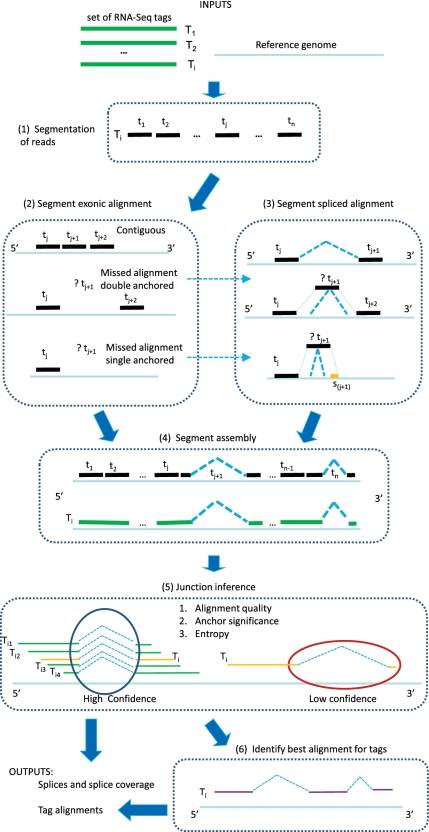
 are determined. In the ‘splice inference' phase, splice junctions that appear in one or more tag alignments are analyzed to determine a splice significance score based on the quality and diversity of alignments that include the splice. Ambiguous candidate alignments are resolved by selecting the alignment with the overall highest quality match and highest confidence splice junctions.
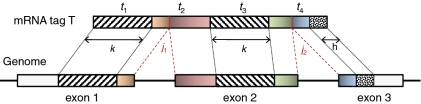
 consists of the 3′ end of exon 1, all of exon 2 and the 5′ end of exon 3.
  is split into segments t1,…, tn each of length
  to identify the alignment of
  to the genome. Provided no exon has a length less than
  nucleotides, at least one of every two consecutive segments must have an exonic alignment. In this example with
  segments t1 and t3 have exonic alignment. Segment t2 has spliced alignment; the splice junction
  can be easily discovered using the double-anchor search method starting from t1 and t3. The spliced alignment for t4 is discovered by searching downstream in the genome for an occurrence of the suffix
  -mer of t4. When such an occurrence is found, the double-anchor search method is used to evaluate a possible splice junction
  between
  and the
  -mer occurrence.
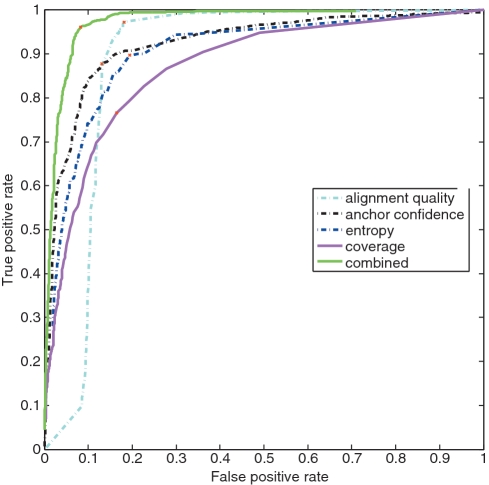
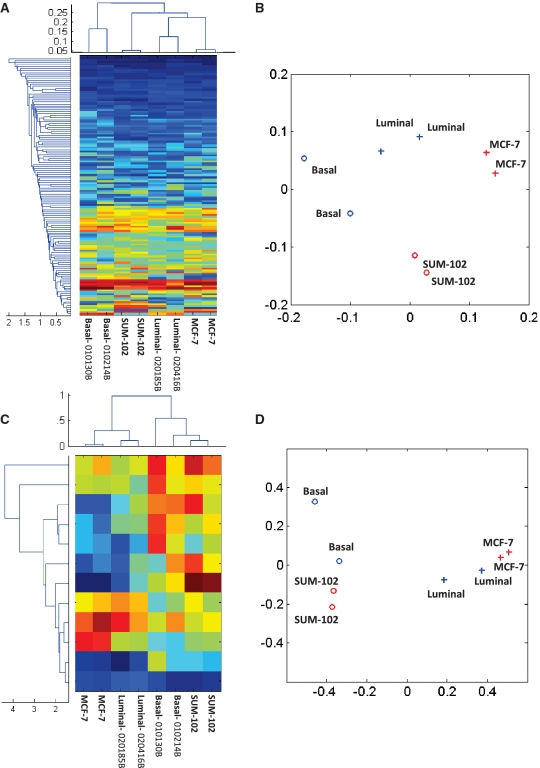
 0.001. The matrix of their skipping ratios are shown in the heatmap. Both rows and columns were clustered. (D) A scatter plot of the eight samples along the first and second principal components generated from the PCA of the correlation distance matrix of the eight samples based on the 11 selected events.
References
-
- Andersen LB, Ballester R, Marchuk DA, Chang E, Gutmann DH, Saulino AM, Camonis J, Wigler M, Collins FS. A conserved alternative splice in the von Recklinghausen neurofibromatosis (NF1) gene produces two neurofibromin isoforms, both of which have GTPase-activating protein activity. Mol. Cell. Biol. 1993;13:487–495. - PMC - PubMed
-
- Kwan T, Benovoy D, Dias C, Gurd S, Provencher C, Beaulieu P, Hudson TJ, Sladek R, Majewski J. Genome-wide analysis of transcript isoform variation in humans. Nat. Genet. 2008;40:225–231. - PubMed
Publication types
MeSH terms
Substances
Grants and funding
LinkOut - more resources
Full Text Sources
Other Literature Sources
