. 2010 Sep 15;29(18):3156-69.
doi: 10.1038/emboj.2010.205. Epub 2010 Aug 27.

ATR and ATM differently regulate WRN to prevent DSBs at stalled replication forks and promote replication fork recovery

Affiliations

ATR and ATM differently regulate WRN to prevent DSBs at stalled replication forks and promote replication fork recovery

Francesca Ammazzalorso et al. EMBO J. .

Abstract

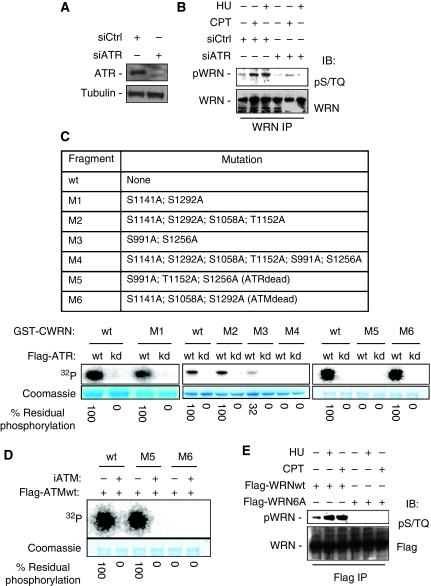
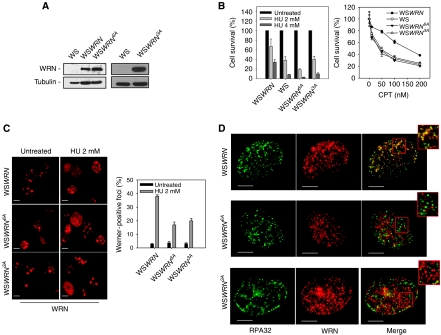
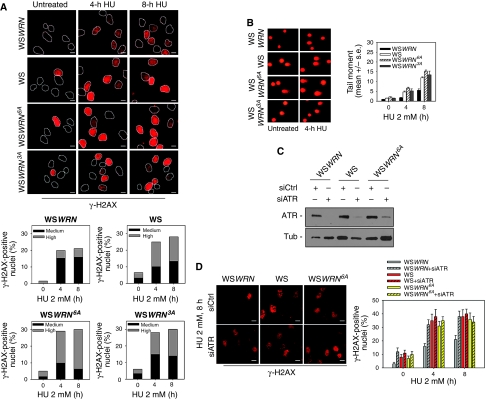
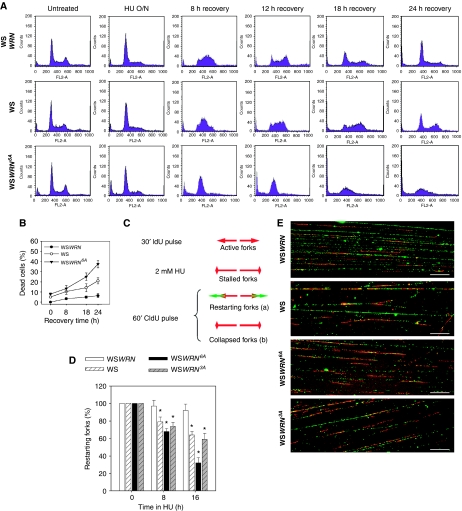
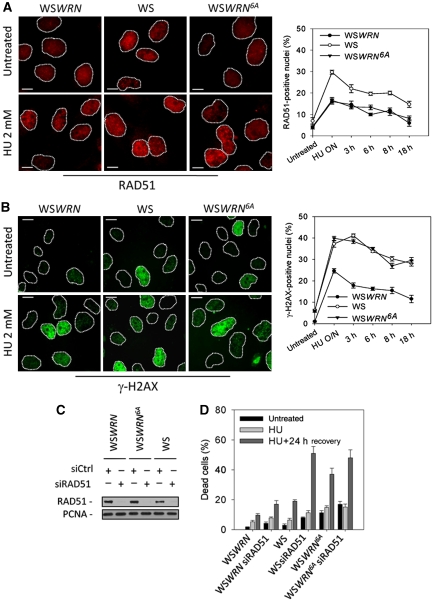
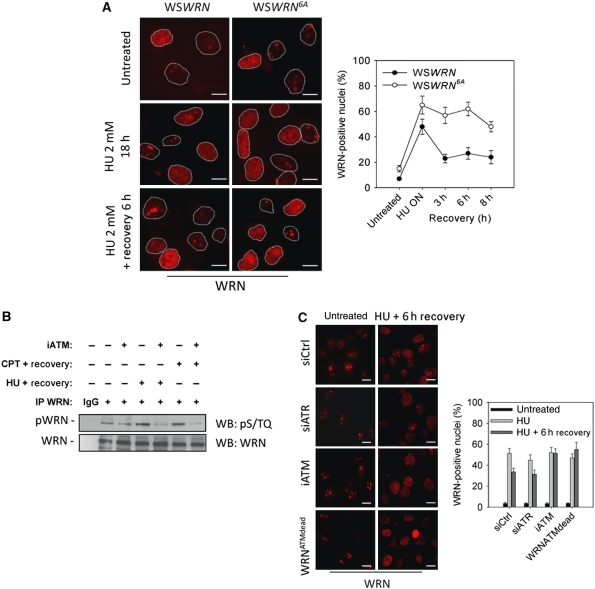
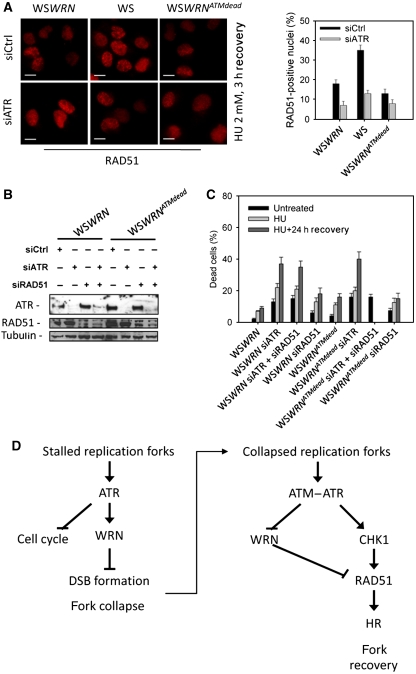
Accurate response to replication arrest is crucial to preserve genome stability and requires both the ATR and ATM functions. The Werner syndrome protein (WRN) is implicated in the recovery of stalled replication forks, and although an ATR/ATM-dependent phosphorylation of WRN was observed after replication arrest, the function of such modifications during the response to perturbed replication is not yet appreciated. Here, we report that WRN is directly phosphorylated by ATR at multiple C-terminal S/TQ residues. Suppression of ATR-mediated phosphorylation of WRN prevents proper accumulation of WRN in nuclear foci, co-localisation with RPA and causes breakage of stalled forks. On the other hand, inhibition of ATM kinase activity or expression of an ATM-unphosphorylable WRN allele leads to retention of WRN in nuclear foci and impaired recruitment of RAD51 recombinase resulting in reduced viability after fork collapse. Altogether, our findings indicate that ATR and ATM promote recovery from perturbed replication by differently regulating WRN at defined moments of the response to replication fork arrest.


Conflict of interest statement

The authors declare that they have no conflict of interest.

Figures

Figure 1
Figure 1
WRN is phosphorylated by ATR at multiple sites of the C-terminal region. (A) Depletion of ATR. HeLa cells were transfected with control siRNAs or siRNAs directed against ATR, and 48 h later, cell lysates were subjected to immunoblotting with anti-ATR antibody. Tubulin was used as loading control. (B) Evaluation of WRN phosphorylation in ATR-depleted cells. After siRNA transfection, HeLa cells were treated with 2 mM HU or 10 μM CPT for 6 h. Cell extracts were immunoprecipitated (IP) using anti-WRN antibody followed by immunoblotting with an anti-pST/Q antibody. Total WRN was used to evaluate the amount of WRN immunoprecipitated. (C) Identification of ATR phosphorylation sites on the C-terminal region of WRN by immunocomplex kinase assay. Top, schematic representation of the GST-tagged C-terminal wild-type or mutant forms of WRN. Locations of multiple Ala substitutions are indicated. Below, in vitro kinase assay. GST-C-terminal wild-type (wt) or mutants WRN (M1, M2, M3, M4, M5 and M6) were incubated with the wild-type or inactive form of ATR immunopurified from HeLa cells in the presence of 32P-ATP (for details see ‘Materials and methods'). After separation by SDS–PAGE, the presence of phosphorylation was assessed by phosphorimaging. The amount of C-terminal WRN fragments used is shown by Coomassie staining. Phosphorylation levels were expressed as the percentage of residual phosphorylation of each mutant fragment compared with the wild type. (D) Analysis of in vitro phosphorylation of C-terminal WRN fragment by ATM. The wild type (wt) and both the M5 and M6 mutant fragments containing, respectively, Ala changes at the ATR or at the ATM phosphorylation sites were incubated with immunopurified Flag-ATM with or without 10 μM KU55933 (iATM). (E) Analysis of mutant WRN phosphorylation. HEK293T cells were transfected with plasmids expressing a Flag-tagged full-length WRN wild type or carrying Ala substitutions at all the six S/TQ sites (6A) and 48 h later treated with 2 mM HU or 10 μM CPT for 6 h. Cell extracts were immunoprecipitated (IP) using anti-WRN antibody following immunoblotting with an anti-pST/Q antibody. Anti-Flag tag antibody was used to evaluate the amount of wild-type or mutant form WRN immunoprecipitated.
Figure 2
Figure 2
WRN re-localisation and co-localisation with RPA upon replication arrest depend on its phosphorylation by ATR. (A) Western blotting on extracts from WS cells stably expressing the Flag-tagged wild-type WRN (WSWRN), the 6A mutant (WSWRN6A) or the ATR-unphosphorylable form of WRN (WSWRN3A) showing levels of WRN using an anti-WRN antibody. WS cells were used as negative control and tubulin as loading control. (B) Cells were treated with different doses of HU or CPT for 16 h and allowed to grow in drug-free medium for 2 weeks before analysis of clonogenic survival. Survival is expressed as percentage of the untreated cultures. Data are presented as mean±s.e. from three independent experiments. (C) Analysis of WRN re-localisation to nuclear foci after replication arrest. Images show WRN nuclear distribution with or without 8 h treatment. The graph shows the percentage of WRN-positive nuclei. Data are presented as means of three independent experiments. Error bars represent standard errors. (D) Analysis of WRN and RPA co-localisation after replication arrest. Cells were treated with 2 mM HU for 8 h and subjected to immunofluorescence using anti-WRN and anti-RPA32 antibodies. Representative images from cells treated with HU for 8 h are presented. Insets show an enlarged portion of the nuclei for a better evaluation of the co-localisation status of WRN with RPA32 foci. Scale bars, 10 μm.
Figure 3
Figure 3
WRN phosphorylation by ATR is required to prevent accumulation of DNA breakage after replication arrest. (A) Analysis of DNA breakage using γ-H2AX immunostaining. Cells were exposed to HU for the indicated times and stained with an antibody against γ-H2AX. In the panel, representative images from each experimental point are shown. Graphs show the percentage of γ-H2AX-positive nuclei with medium or high intensity of γ-H2AX fluorescence. (B) DNA breakage as detected using a neutral comet assay. Cells were treated with HU for the indicated times and then subjected to comet assay. In the panel, representative images are shown. Data are presented as mean tail moment and as means of three independent experiments. Error bars represent standard errors. Where not depicted, standard errors were <15% of the mean. (C) Depletion of ATR. WS, WSWRN or WSWRN6A cells were transfected with control siRNAs or siRNAs directed against ATR and cell lysates subjected to immunoblotting with anti-ATR antibody. Tubulin was used as loading control. (D) Analysis of DNA breakage by γ-H2AX in WS, WSWRN or WSWRN6A cells in which ATR was depleted using RNAi. After transfection, cells were treated with 2 mM HU for the indicated times and stained with an antibody against γ-H2AX. In the panel, representative images are shown. Graphs show the percentage of γ-H2AX-positive nuclei. Data are presented as means of three independent experiments and error bars represent standard errors. Scale bars, 10 μm.
Figure 4
Figure 4
WRN phosphorylation is necessary for the cellular recovery from prolonged replication arrest and for replication fork restart. (A) Analysis of cell cycle progression after replication arrest. Cells were treated overnight with 2 mM HU, samples collected at the indicated recovery times and subjected to FACS analysis. (B) Evaluation of cell viability by LIVE/DEAD assay. WS, WSWRN or WSWRN6A cells were treated with 2 mM HU for the indicated times. Cell viability was evaluated as described in ‘Materials and methods'. Data are presented as per cent of dead cells and as means of three independent experiments. Error bars represent standard errors. (C) Schematic representation of experimental design used to measure replication fork recovery and examples of replication track labelling after recovery, labelled replication tracks showing stalled forks recovering upon HU removal (a) or forks collapsed after HU treatment (b). (D) Graph shows quantification of restarting forks evaluated by dividing the number of restarting forks (i.e. ‘a' tracks) by the total number of forks (i.e. a+b). WS, WSWRN, WSWRN6A or WSWRN3A cells were treated with 2 mM HU for the indicated times and recovered for 1 h in IdU-containing medium before DNA fibre assay. Data are presented as means±s.e. from three independent experiments. *Statistically significant (P<0.01) by a Student's t-test. (E) Images of DNA fibres visualised by immunofluorescence detection. Images derived from samples treated with HU for 16 h. Scale bars, 20 μm.
Figure 5
Figure 5
Analysis of the activation of RAD51-dependent pathway after replication arrest. (A) Analysis of RAD51 re-localisation in foci. Cells were treated with HU for 18 h, released into drug-free medium for the indicated times and stained with an antibody against RAD51. Images show cells with RAD51 re-localisation in foci at 18 h of HU. Graph shows the percentage of RAD51-positive nuclei for each experimental condition. (B) Evaluation of DNA breakage accumulation by γ-H2AX immunofluorescence. Cells were treated as in (A). Representative images from the 18 h HU treatment. Graph shows the percentage of γ-H2AX-positive nuclei for each experimental condition. (C) Depletion of RAD51. WSWRN, WSWRN6A and WS cells were transfected with control siRNAs or siRNAs directed against RAD51 and cell lysates subjected to immunoblotting with anti-RAD51 antibody. PCNA was used as loading control. (D) Evaluation of cell viability by LIVE/DEAD assay. After siRNAs transfection, WSWRN, WS and WSWRN6A cells were treated overnight with 2 mM HU and recovered in drug-free medium for 24 h. Data are presented as per cent of dead cells and as means of three independent experiments. Error bars represent standard errors. Scale bars, 10 μm.
Figure 6
Figure 6
Loss of ATM-dependent phosphorylation impairs WRN de-localisation during the recovery from prolonged replication arrest. (A) Analysis of WRN re-localisation in foci. WSWRN or WSWRN6A cells were treated with 2 mM HU for 18 h (HU O/N), recovered for the indicated times and stained with an antibody against WRN. Representative images are shown. Scale bars, 10 μm. Graph shows the percentage of WRN-positive nuclei for each experimental point. (B) Analysis of WRN phosphorylation during recovery from replication fork stalling. WSWRN cells were treated with 10 μM CPT or 2 mM HU for 8 or 18 h, respectively, and recovered for 3 h before preparation of whole cell extracts for anti-WRN IP. When indicated, cells were also treated from 1 h before inducing replication arrest to the sampling time with 10 μM of the KU55933, an ATM inhibitor (iATM). Anti-WRN IP were separated by SDS–PAGE and subjected to WB using an anti-pS/TQ antibody. One-third of IPs was subjected to WB using total anti-WRN antibody. IgG represents Ctrl IP. (C) Analysis of WRN re-localisation in foci in the absence of ATM-dependent phosphorylation. WSWRN or WSWRNATMdead cells were treated with 2 mM HU for 18 h (HU O/N), with or without 8 h of recovery. In some cases, WSWRN cells were transfected 48 h before treatment with Ctrl siRNAs or ATR siRNA, whereas exposure to 10 μM KU55933 during treatments and recovery was used to inhibit ATM (iATM). Representative images are shown. Scale bars, 10 μm. Graph shows the percentage of WRN-positive nuclei for each experimental point. Data are presented as means of three independent experiments and error bars represent standard errors.
Figure 7
Figure 7
Formation of RAD51 foci and recovery from prolonged replication arrest requires WRN de-localisation from nuclear foci. (A) Analysis of RAD51 re-localisation in foci in the absence of ATM-dependent WRN phosphorylation. WSWRN, WS or WSWRNATMdead cells were transfected with control siRNAs or siRNAs directed against ATR and treated with 2 mM HU for 18 h followed by a 3 h recovery period before being analysed for the presence of RAD51 foci. Scale bars, 10 μm. (B) Concomitant depletion of ATR and RAD51. WSWRN or WSWRNATMdead cells were transfected with control siRNAs or siRNAs directed against ATR and/or RAD51 and cell lysates subjected to immunoblotting with anti-ATR or anti-RAD51 antibody. Tubulin was used as loading control. (C) Evaluation of cell viability by LIVE/DEAD assay. After concomitant depletion of ATR and RAD51, WSWRN and WSWRNATMdead cells were treated for 18 h with HU before recovery in drug-free medium. Cell viability was evaluated as described in ‘Materials and methods'. Data are presented as per cent of dead cells and as means of three independent experiments. Error bars represent standard errors. (D) Schematic model of the dual function of ATR and ATM in ensuring correct recovery from stalled and collapsed forks after HU treatment.

References

    1. Ababou M, Dutertre S, Lecluse Y, Onclercq R, Chatton B, Amor-Gueret M (2000) ATM-dependent phosphorylation and accumulation of endogenous BLM protein in response to ionizing radiation. Oncogene 19: 5955–5963 - PubMed
    1. Arlt MF, Durkin SG, Ragland RL, Glover TW (2006) Common fragile sites as targets for chromosome rearrangements. DNA Repair (Amst) 5: 1126–1135 - PubMed
    1. Arnaudeau C, Lundin C, Helleday T (2001) DNA double-strand breaks associated with replication forks are predominantly repaired by homologous recombination involving an exchange mechanism in mammalian cells. J Mol Biol 307: 1235–1245 - PubMed
    1. Beamish H, Kedar P, Kaneko H, Chen P, Fukao T, Peng C, Beresten S, Gueven N, Purdie D, Lees-Miller S, Ellis N, Kondo N, Lavin MF (2002) Functional link between BLM defective in Bloom's syndrome and the ataxia-telangiectasia-mutated protein, ATM. J Biol Chem 277: 30515–30523 - PubMed
    1. Bohr VA (2008) Rising from the RecQ-age: the role of human RecQ helicases in genome maintenance. Trends Biochem Sci 33: 609–620 - PMC - PubMed

Publication types

MeSH terms