. 2010 Aug 12:4:18.
doi: 10.3389/fncir.2010.00018. eCollection 2010.

Optical mapping of release properties in synapses

Affiliations

Optical mapping of release properties in synapses

Pablo Ariel et al. Front Neural Circuits. .

Abstract

Synapses are important functional units that determine how information flows through the brain. Understanding their biophysical properties and the molecules that underpin them is an important goal of cellular neuroscience. Thus, it is of interest to develop protocols that allow easy measurement of synaptic parameters in model systems that permit molecular manipulations. Here, we used a sensitive and high-time resolution optical approach that allowed us to characterize two functional parameters critical to presynaptic efficacy: vesicle fusion probability (Pv) and readily-releasable pool size (RRP). We implemented two different approaches to determine the RRP size that were in broad agreement: depletion of the RRP by high-frequency stimulation and saturation of the calcium sensor during single action potential stimuli. Our methods are based on reporters that provide a robust, quantitative, purely presynaptic readout and present a new avenue to study molecules that affect synaptic vesicle exocytosis.

Keywords: exocytosis; imaging; pHluorin; readily-releasable pool; release probability; synapse.


Figures

Figure 1
Figure 1
Exocytosis in response to 1 AP measured at 10 ms time resolution with vG-pH. (A) Representative traces of a neuron's response to 1 AP (n = 25 synapses). (B) Response to 1200 APs at 10 Hz in the presence of Baf for the same neuron.
Figure 2
Figure 2
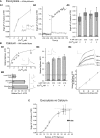
Single APs cause exocytosis of the entire RRP in conditions with large intracellular calcium increases. (A1) Exocytosis in response to 1 AP as a function of extracellular calcium (n = 14 cells). Inset: representative individual trials at 2 mM (gray) and 4 mM (black) from one cell. Scale bar = 1% of TRP, 100 ms. (A2) Representative experiment showing responses to a single AP under control conditions (2 mM external calcium, gray) and with 2.5 mM 4-AP (black). Note the presence of fast (arrow) and slow subcomponents of delayed release after the end of stimulus-locked exocytosis (arrowhead). n = 7 and 3 trials for control and 4-AP respectively. (A3) Average responses to single APs under different 4-AP and extracellular calcium conditions. The bars show the stimulus-locked (light gray) and fast delayed (dark gray) components of exocytosis with their SEs. (B1) Average relative peak ΔF/F0 as a function of external calcium across several experiments. The line is a fit (to the measurements) by a single site binding model (equation (4), Km = 2.3 ± 0.4 mM, Rmax = 2.2 ± 0.2). Inset: responses to 1 AP at 2 mM (gray) and 4 mM (black) in a representative experiment (n = 4 trials each). (B2) Effects of calcium channel toxins on single AP responses measured with Fluo-3 AM. Beside each column there is an average control (black) and toxin (red) trace from a representative experiment (n = 3–5 trials each). Scale bar = 20% ΔF/F0, 50 ms (B3) Increases in intracellular calcium concentration in response to 1 AP relative to control in different 4-AP and extracellular calcium conditions. Inset: response to control (gray, n = 5 trials) and 4-AP (black, n = 13 trials) from a representative experiment with 2.5 mM 4-AP. Scale bar = 2% ΔF/F0, 50 ms. (B4) Top: representative experiment showing responses to 1 AP (blue) and 2 s stimuli at 10, 25, 33 and 50 Hz (black). Scale bar = 10% ΔF/F0, 0.5 s. Traces are averages of 3 trials for 2 s stimuli and 13 trials for the 1 AP stimulus. Bottom: average steady state ΔF/F0 at the end of 2 s stimuli of varying frequencies (n = 4 experiments). Responses are normalized to the single AP peak in each experiment. Line shows fit (P < 0.001, R2= 0.995). (C) Exocytosis as a function of the relative increase in internal calcium concentration (n = 10–16 vG-pH experiments, n = 9–20 MgGreen experiments). The line shows the fit to a generalized Hill model (Eq. 3, RRP = 5.9 ± 0.7% of TRP, n = 3.4 ± 0.4, K = 1.9 ± 0.2).
Figure 3
Figure 3
Bursts of action potentials at 100 Hz in 4 mM external calcium deplete the RRP after exocytosis of ∼7% of the TRP. (A–C) Responses to different stimuli in the same cell (average of 11 synapses). Responses to 20 (A) and 40 Hz (B) come from individual trials, response to 100 Hz burst (C) is the average of 4 trials. The plateau indicating the depletion of the RRP (C) was detected automatically (see Materials and Methods). (D) Calcium entry at 100 Hz, 4 mM (n = 6 experiments). Values normalized to first AP. (E) RRP size determined from 100 Hz bursts in 24 cells (see Materials and Methods for explanation of error bars). Box whisker plot shows the median (line), mean (point), 25–75 percentile (box) and 10–90 percentile (whisker) ranges.
Figure 4
Figure 4
Different estimates of RRP size are consistent. (A) Example of a neuron (average of 30 synapses) where both methods were used to estimate RRP size (n = 4 trials for A1, n = 5 trials for A2). Note that the vertical scale on both graphs is the same. (B) RRP size determined from single APs in the presence of 250 μM 4-AP and 4 mM external calcium agrees with estimates from 100 Hz bursts (n = 8 cells).
Figure 5
Figure 5
Pv varies over a wide range across cells. (A) Procedure for determining a neuron's Pv requires a measurement of the response to 1 AP (A1, n = 20 trial average, 12 synapses) and an estimate of the RRP size (A2, n = 4 trial average). Values within each panel are in % of TRP. The trace from (A1) was scaled down 10-fold in the inset in (A2) to be at the same vertical scale as the 100 Hz burst measurement. (B) Pv determined with this protocol in 32 cells (see Materials and Methods for explanation of error bars). Box whisker plot shows the median (line), mean (point), 25–75 percentile (box) and 10–90 percentile (whisker) ranges.

Similar articles

Cited by

References

    1. Abenavoli A., Forti L., Bossi M., Bergamaschi A., Villa A., Malgaroli A. (2002). Multimodal quantal release at individual hippocampal synapses: evidence for no lateral inhibition. J. Neurosci. 22, 6336–6346 - PMC - PubMed
    1. Atluri P. P., Ryan T. A. (2006). The kinetics of synaptic vesicle reacidification at hippocampal nerve terminals. J. Neurosci. 26, 2313–232010.1523/JNEUROSCI.4425-05.2006 - DOI - PMC - PubMed
    1. Balaji J., Ryan T. A. (2007). Single-vesicle imaging reveals that synaptic vesicle exocytosis and endocytosis are coupled by a single stochastic mode. Proc. Natl. Acad. Sci. U.S.A. 104, 20576–2058110.1073/pnas.0707574105 - DOI - PMC - PubMed
    1. Branco T., Staras K., Darcy K. J., Goda Y. (2008). Local dendritic activity sets release probability at hippocampal synapses. Neuron 59, 475–48510.1016/j.neuron.2008.07.006 - DOI - PMC - PubMed
    1. Chapman E. R. (2008). How does synaptotagmin trigger neurotransmitter release? Annu. Rev. Biochem. 77, 615–64110.1146/annurev.biochem.77.062005.101135 - DOI - PubMed

LinkOut - more resources