A common variant in the patatin-like phospholipase 3 gene (PNPLA3) is associated with fatty liver disease in obese children and adolescents
- PMID: 20803499
- PMCID: PMC3221304
- DOI: 10.1002/hep.23832
A common variant in the patatin-like phospholipase 3 gene (PNPLA3) is associated with fatty liver disease in obese children and adolescents
Abstract
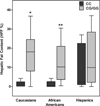
The genetic factors associated with susceptibility to nonalcoholic fatty liver disease (NAFLD) in pediatric obesity remain largely unknown. Recently, a nonsynonymous single-nucleotide polymorphism (rs738409), in the patatin-like phospholipase 3 gene (PNPLA3) has been associated with hepatic steatosis in adults. In a multiethnic group of 85 obese youths, we genotyped the PNLPA3 single-nucleotide polymorphism, measured hepatic fat content by magnetic resonance imaging and insulin sensitivity by the insulin clamp. Because PNPLA3 might affect adipogenesis/lipogenesis, we explored the putative association with the distribution of adipose cell size and the expression of some adipogenic/lipogenic genes in a subset of subjects who underwent a subcutaneous fat biopsy. Steatosis was present in 41% of Caucasians, 23% of African Americans, and 66% of Hispanics. The frequency of PNPLA3(rs738409) G allele was 0.324 in Caucasians, 0.183 in African Americans, and 0.483 in Hispanics. The prevalence of the G allele was higher in subjects showing hepatic steatosis. Surprisingly, subjects carrying the G allele showed comparable hepatic glucose production rates, peripheral glucose disposal rate, and glycerol turnover as the CC homozygotes. Carriers of the G allele showed smaller adipocytes than those with CC genotype (P = 0.005). Although the expression of PNPLA3, PNPLA2, PPARγ2(peroxisome proliferator-activated receptor gamma 2), SREBP1c(sterol regulatory element binding protein 1c), and ACACA(acetyl coenzyme A carboxylase) was not different between genotypes, carriers of the G allele showed lower leptin (LEP)(P = 0.03) and sirtuin 1 (SIRT1) expression (P = 0.04).
Conclusion: A common variant of the PNPLA3 gene confers susceptibility to hepatic steatosis in obese youths without increasing the level of hepatic and peripheral insulin resistance. The rs738409 PNPLA3 G allele is associated with morphological changes in adipocyte cell size.
Conflict of interest statement
Potential conflict of interest: Dr. Shulman is a consultant for Pfizer, Sarnoff, GlaxoSmithKline, LG Life Sciences, Rigel, Sanofi-Aventis, Roche, Well State Therapeutics, Arete, Eli Lilly, and Forest labs.
Figures


Comment in
-
Patatin-like phospholipase domain-containing 3 and the pathogenesis and progression of pediatric nonalcoholic fatty liver disease.Hepatology. 2010 Oct;52(4):1189-92. doi: 10.1002/hep.23946. Hepatology. 2010. PMID: 20879029 Free PMC article. No abstract available.
References
-
- D’Adamo E, Santoro N, Caprio C. Metabolic syndrome in pediatrics: old concepts revised, new concepts discussed. Endocr Metab Clin North Am. 2009;38:549–563. - PubMed
-
- Tominaga K, Kurata JH, Chen YK, Fujimoto E, Miyagawa S, Abe I, et al. Prevalence of fatty live in japanese children and relationship to obesity. An epidemiological ultrasonographic survey. Dig Dis Sci. 1995;40:2002–2009. - PubMed
-
- Angulo P. Nonalcoholic fatty live disease. N Engl J Med. 2002;346:1221–1231. - PubMed
-
- Schwimmer JB, Deutsch R, Kahen T, Lavine JE, Stanley C, Behling C. Prevalence of fatty live in children and adolescents. Pediatrics. 2006;118:1388–1393. - PubMed
Publication types
MeSH terms
Substances
Grants and funding
- R24 DK085638/DK/NIDDK NIH HHS/United States
- K24 HD001464/HD/NICHD NIH HHS/United States
- ImNIH/Intramural NIH HHS/United States
- P30 DK034989/DK/NIDDK NIH HHS/United States
- UL1 RR0249139/RR/NCRR NIH HHS/United States
- R01 DK049230/DK/NIDDK NIH HHS/United States
- R01 HD028016/HD/NICHD NIH HHS/United States
- R01 HD040787/HD/NICHD NIH HHS/United States
- K24-HD01464/HD/NICHD NIH HHS/United States
- R01-EB006494/EB/NIBIB NIH HHS/United States
- R01 EB006494/EB/NIBIB NIH HHS/United States
- R01-HD40787/HD/NICHD NIH HHS/United States
- R01-HD28016/HD/NICHD NIH HHS/United States
- HHMI/Howard Hughes Medical Institute/United States
- R01 DK49230/DK/NIDDK NIH HHS/United States
LinkOut - more resources
Full Text Sources
Medical
Miscellaneous
