

Lipid-protein correlations in nanoscale phospholipid bilayers determined by solid-state nuclear magnetic resonance
- PMID: 20804175
- PMCID: PMC3136391
- DOI: 10.1021/bi1013722
Lipid-protein correlations in nanoscale phospholipid bilayers determined by solid-state nuclear magnetic resonance
Abstract
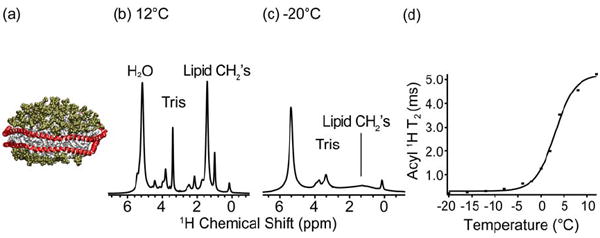
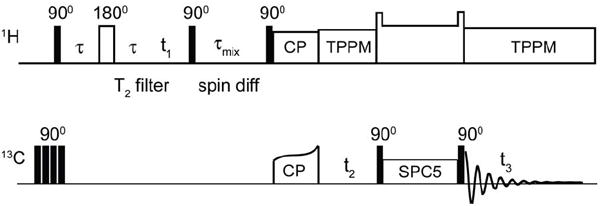
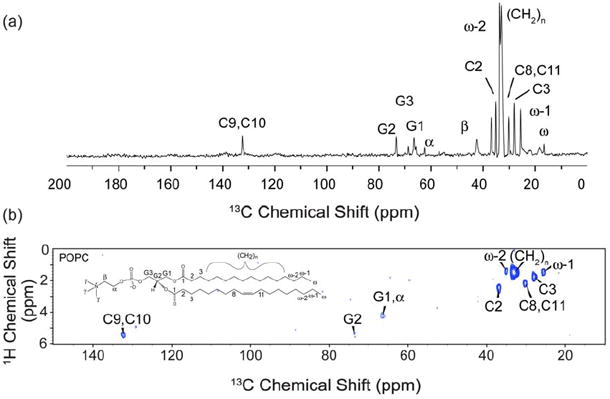
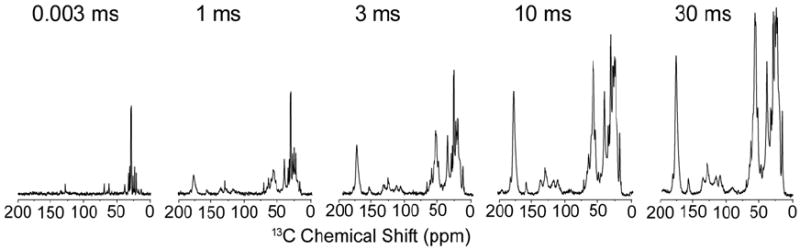
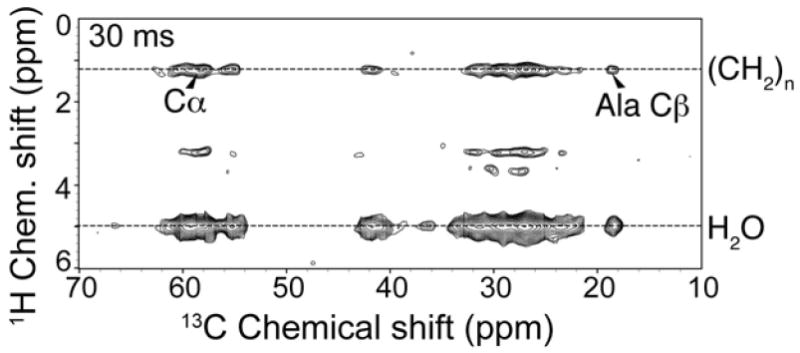
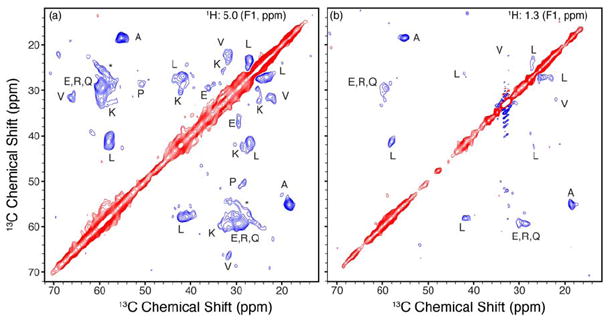
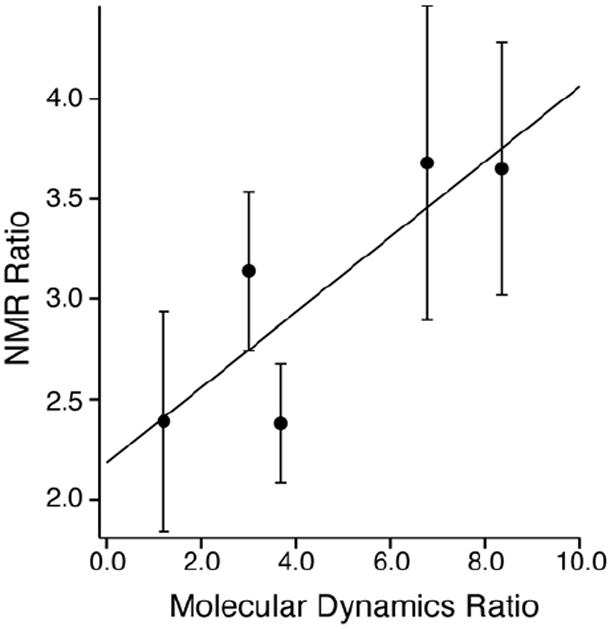
Nanodiscs are examples of discoidal nanoscale lipid-protein particles that have been extremely useful for the biochemical and biophysical characterization of membrane proteins. They are discoidal lipid bilayer fragments encircled and stabilized by two amphipathic helical proteins named membrane scaffolding protein (MSP), ~10 nm in size. Nanodiscs are homogeneous, easily prepared with reproducible success, amenable to preparations with a variety of lipids, and stable over a range of temperatures. Here we present solid-state nuclear magnetic resonance (SSNMR) studies on lyophilized, rehydrated POPC Nanodiscs prepared with uniformly (13)C-, (15)N-labeled MSP1D1 (Δ1-11 truncated MSP). Under these conditions, by SSNMR we directly determine the gel-to-liquid crystal lipid phase transition to be at 3 ± 2 °C. Above this phase transition, the lipid (1)H signals have slow transverse relaxation, enabling filtering experiments as previously demonstrated for lipid vesicles. We incorporate this approach into two- and three-dimensional heteronuclear SSNMR experiments to examine the MSP1D1 residues interfacing with the lipid bilayer. These (1)H-(13)C and (1)H-(13)C-(13)C correlation spectra are used to identify and quantify the number of lipid-correlated and solvent-exposed residues by amino acid type, which furthermore is compared with molecular dynamics studies of MSP1D1 in Nanodiscs. This study demonstrates the utility of SSNMR experiments with Nanodiscs for examining lipid-protein interfaces and has important applications for future structural studies of membrane proteins in physiologically relevant formulations.
Figures
Similar articles
-
Structure and orientation of antibiotic peptide alamethicin in phospholipid bilayers as revealed by chemical shift oscillation analysis of solid state nuclear magnetic resonance and molecular dynamics simulation.Biochim Biophys Acta. 2015 Nov;1848(11 Pt A):2789-98. doi: 10.1016/j.bbamem.2015.07.019. Epub 2015 Aug 3. Biochim Biophys Acta. 2015. PMID: 26248014
-
Smaller Nanodiscs are Suitable for Studying Protein Lipid Interactions by Solution NMR.Protein J. 2015 Jun;34(3):205-11. doi: 10.1007/s10930-015-9613-2. Protein J. 2015. PMID: 25980794
-
Exploring Lipid and Membrane Protein Dynamics Using Lipid-Bilayer Nanodiscs and Solution-State NMR Spectroscopy.Methods Mol Biol. 2020;2127:397-419. doi: 10.1007/978-1-0716-0373-4_25. Methods Mol Biol. 2020. PMID: 32112335
-
Advances in the use of nanoscale bilayers to study membrane protein structure and function.Biotechnol Genet Eng Rev. 2014 Oct;30(1-2):79-93. doi: 10.1080/02648725.2014.921502. Biotechnol Genet Eng Rev. 2014. PMID: 25023464 Review.
-
Biophysical characterization of membrane proteins in nanodiscs.Methods. 2013 Mar;59(3):287-300. doi: 10.1016/j.ymeth.2012.11.006. Epub 2012 Dec 3. Methods. 2013. PMID: 23219517 Free PMC article. Review.
Cited by
-
Structure of the disulfide bond generating membrane protein DsbB in the lipid bilayer.J Mol Biol. 2013 May 27;425(10):1670-82. doi: 10.1016/j.jmb.2013.02.009. Epub 2013 Feb 14. J Mol Biol. 2013. PMID: 23416557 Free PMC article.
-
Conformational transitions in the membrane scaffold protein of phospholipid bilayer nanodiscs.Mol Cell Proteomics. 2011 Sep;10(9):M111.010876. doi: 10.1074/mcp.M111.010876. Epub 2011 Jun 29. Mol Cell Proteomics. 2011. PMID: 21715319 Free PMC article.
-
Nanodiscs: A toolkit for membrane protein science.Protein Sci. 2021 Feb;30(2):297-315. doi: 10.1002/pro.3994. Epub 2020 Nov 16. Protein Sci. 2021. PMID: 33165998 Free PMC article. Review.
-
Solid-state NMR of the Yersinia pestis outer membrane protein Ail in lipid bilayer nanodiscs sedimented by ultracentrifugation.J Biomol NMR. 2015 Apr;61(3-4):275-86. doi: 10.1007/s10858-014-9893-4. Epub 2015 Jan 13. J Biomol NMR. 2015. PMID: 25578899 Free PMC article.
-
Nanodiscs: A Controlled Bilayer Surface for the Study of Membrane Proteins.Annu Rev Biophys. 2018 May 20;47:107-124. doi: 10.1146/annurev-biophys-070816-033620. Epub 2018 Mar 1. Annu Rev Biophys. 2018. PMID: 29494254 Free PMC article.
References
-
- Zwaal RF, Comfurius P, Bevers EM. Lipid-protein interactions in blood coagulation. Biochim Biophys Acta. 1998;1376:433–453. - PubMed
-
- Shaw AW, Pureza VS, Sligar SG, Morrissey JH. The local phospholipid environment modulates the activation of blood clotting. J Biol Chem. 2007;282:6556–6563. - PubMed
-
- Yun CH, Ahn T, Guengerich FP. Conformational change and activation of cytochrome P450 2B1 induced by salt and phospholipid. Arch Biochem Biophys. 1998;356:229–238. - PubMed
-
- Kim KH, Ahn T, Yun CH. Membrane properties induced by anionic phospholipids and phosphatidylethanolamine are critical for the membrane binding and catalytic activity of human cytochrome P450 3A4. Biochemistry. 2003;42:15377–15387. - PubMed
-
- Ahn T, Guengerich FP, Yun CH. Membrane insertion of cytochrome P450 1A2 promoted by anionic phospholipids. Biochemistry. 1998;37:12860–12866. - PubMed
Publication types
MeSH terms
Substances
Grants and funding
LinkOut - more resources
Full Text Sources
Research Materials
