. 2010 Nov 1;347(1):167-79.
doi: 10.1016/j.ydbio.2010.08.021. Epub 2010 Sep 6.

Twist1 promotes heart valve cell proliferation and extracellular matrix gene expression during development in vivo and is expressed in human diseased aortic valves

Affiliations

Twist1 promotes heart valve cell proliferation and extracellular matrix gene expression during development in vivo and is expressed in human diseased aortic valves

Santanu Chakraborty et al. Dev Biol. .

Abstract

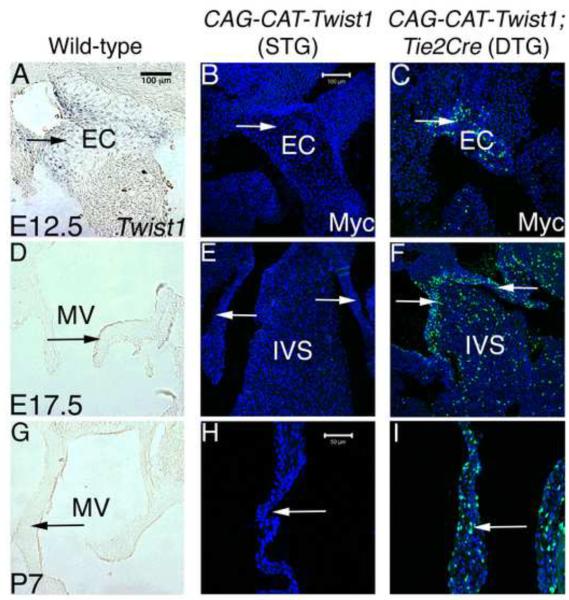
During embryogenesis the heart valves develop from undifferentiated mesenchymal endocardial cushions (EC), and activated interstitial cells of adult diseased valves share characteristics of embryonic valve progenitors. Twist1, a class II basic-helix-loop-helix (bHLH) transcription factor, is expressed during early EC development and is down-regulated later during valve remodeling. The requirements for Twist1 down-regulation in the remodeling valves and the consequences of prolonged Twist1 activity were examined in transgenic mice with persistent expression of Twist1 in developing and mature valves. Persistent Twist1 expression in the remodeling valves leads to increased valve cell proliferation, increased expression of Tbx20, and increased extracellular matrix (ECM) gene expression, characteristic of early valve progenitors. Among the ECM genes predominant in the EC, Col2a1 was identified as a direct transcriptional target of Twist1. Increased Twist1 expression also leads to dysregulation of fibrillar collagen and periostin expression, as well as enlarged hypercellular valve leaflets prior to birth. In human diseased aortic valves, increased Twist1 expression and cell proliferation are observed adjacent to nodules of calcification. Overall, these data implicate Twist1 as a critical regulator of valve development and suggest that Twist1 influences ECM production and cell proliferation during disease.


Figures

Figure 1
Figure 1. Ectopic Twist1 is expressed in late embryonic and postnatal AV valves in CAG-CAT-Twist1;Tie2Cre transgenic mice
In situ hybridization for mouse Twist1 reveals endogenous expression indicated by arrows in (A) E12 5 endocardial cushion (EC) cells, but not in E17.5 (D) or P7 (G) mitral valve leaflets. Tie2Cre-mediated expression of Myc-tagged Twist1 is apparent by immunofluorescence (arrows, green nuclei) throughout the EC at E12.5 (C), in E17.5 AV valves (F), and P7 MV leaflets (I) in CAG-CAT-Twist1;Tie2Cre (DTG) mice. CAG-CAT-Twist1 (STG) littermates show no immunoreactivity against the Myc antibody at E12.5 (B), E17.5 (E), or P7 (H). Cell nuclei are stained blue with ToPro3. The interventricular septum (IVS) is indicated. Similar results were obtained for n=4 individuals for each genotype. Scale bar represents 100 μm for A–G and 50 μm for H and I.
Figure 2
Figure 2. Twist1 promotes increased cell proliferation in late embryonic but not in postnatal AV valve leaflets
Increased cell proliferation as indicated by p-HH3 immunofluorescence (green nuclei, arrowheads) is apparent in developing valves of E17.5 DTG embryos (B) relative to STG littermates (A). The proliferation marker, Ki-67 (red) is colocalized with Myc-tagged (green) Twist1 protein in E17.5 DTG valve leaflets, as indicated by yellow nuclei and arrowheads in D, compared to control STG leaflets (arrowheads in C). Comparable p-HH3 immunoreactivity is observed in P7 DTG MV leaflets (F) relative to the littermate STG controls (E). (G) p-HH3 reactivity was quantified as the percent of total nuclei positive for pHH3 in 3 separate sections for 4 individuals of each genotype. The percent p-HH3 positive nuclei is increased in E17.5 DTG (23.1%) compared to STG (8.3%) valves. In contrast, similar levels of proliferation are apparent at P7, as indicated by percent p-HH3 positive nuclei in P7 DTG mitral valve leaflets (3.0%) compared to littermate STG controls (3.3%). Statistical significance is determined by Student's t-test, where * denotes p < 0.01. Scale bar represents 50 μm.
Figure 3
Figure 3. Cell proliferation is increased in E17.5 CAG-CAT-Twist1;Tie2Cre (DTG) aortic valves with persistent Twist1 expression
(A, B) Tie2Cre-mediated expression of Myc-tagged Twist1 (green nuclei) in CAG-CAT-Twist1;Tie2Cre mice is detected throughout the E17.5 aortic valve leaflets (arrows in B). In contrast, comparable heart sections from littermate STG embryos show no immunoreactivity against the Myc epitope at E17.5 (arrows in A). (C, D) Persistent Twist1 expression in E17.5 aortic valves leads to increased cell proliferation in CAG-CAT-Twist1;Tie2Cre DTG embryos, as indicated by p-HH3 antibody reactivity (green nuclei indicated by arrows in D), compared to fewer p-HH3 positive green nuclei in STG littermates (arrows in C). (G) p-HH3 reactivity was quantified in 3 separate sections from 3 individuals of each genotype by cell counts of p-HH3 positive nuclei/total nuclei. Increased p-HH3 positive nuclei (23.2%) were observed in E17.5 DTG compared to 7.0% in STG valves. (E, F) In contrast, similar levels of proliferation were detected in DTG and STG aortic valve leaflets at P7, as indicated by percent p-HH3 positive nuclei in P7 DTG aortic valve leaflets (4.6%) compared to littermate STG controls (4.2%). Cell nuclei are stained blue with ToPro3. Statistical significance is determined by Student's t-test, where * denotes p < 0.01. Scale bar represents 50 μm. Ao = aorta; AoV = aortic valve leaflets, LV = left ventricle.
Figure 4
Figure 4. Twist1 promotes Tbx20 expression in late embryonic AV valves
Tbx20 expression, as indicated by immunofluorescence (green), is increased in E17.5 DTG MV leaflets (B, arrows) compared to littermate STG controls (A, arrows). The left ventricle (LV) and interventricular septum (IVS) are indicated. (C) qRT-PCR analysis reveals a 2-fold up-regulation of Tbx20 mRNA in E17.5 DTG valves relative to littermate STG controls. Tbx20 expression is comparable in P7 DTG MV leaflets (E, arrows) and littermate STG controls (D, arrows) as detected by immunofluorescence and qRT-PCR (F). Normalized Tbx20 expression in E17.5 or P7 STG AV valves is set to 1 and then fold-change is calculated for corresponding DTG AV valves. The average base-line levels of Tbx20 relative to L7 expression in STG AV valves are 1.14 at E17.5 and 2.03 in P7, respectively. The average fold increase is depicted, where n = 3 and error bars represent SEM. Statistical significance is determined by Student's t-test, where * denotes p < 0.05. Scale bar represents 50 μm (A, B) and 100 μm (D, E).
Figure 5
Figure 5. Twist1 promotes Tbx20 and Col2a1 expression in late embryonic but not in postnatal aortic valves
(A, B) Tbx20 expression as indicated by immunofluorescence (green) is increased in E17.5 DTG aortic valves (B, arrowheads) compared to littermate STG controls (A, arrowheads). Likewise, increased expression of Col2a1 is detected in E17.5 DTG aortic valves (F, arrowheads) compared to littermate STG controls (E, arrowheads). Expression of Tbx20 (C, D arrowheads) and Col2a1 (G, H arrowheads) proteins is similar for STG and DTG animals at P7. (E–H) Cell nuclei are stained blue with ToPro3. Scale bar represents 50 μm for A, B, E and F; and 100 μm for C, D, G and H. Ao = aorta; AoV = aortic valve, LV = left ventricle.
Figure 6
Figure 6. Expression of early ECM markers characteristic of endocardial cushions is increased in CAG-CAT-Twist1;Tie2Cre mouse valves at E17.5
Expression of ECM proteins (A, B) Col2a1, (C, D) Mmp2 and (E, F) Mmp13 was detected by immunofluorescence (green, arrows) in E17.5 DTG mitral valves and littermate STG controls. (G) qRT-PCR was used to determine mRNA expression levels of Col2a1, Mmp2 and Mmp13 (n=3). The average level of expression for each gene in E17.5 STG AV valves is set to 1 and the fold changes are calculated for the E17.5 DTG AV valves. The average base-line levels of expression relative to the L7 normalization gene are Col2a1 (3.13), Mmp2 (2.98), and Mmp13 (0.30) in E17.5 STG AV valves. Statistical significance is determined by Student's t- test, where * denotes p < 0.05. Scale bar represents 100 μm. IVS = interventricular septum; LV = left ventricle.
Figure 7
Figure 7. Heart valve ECM remodeling, as indicated by expression of fibrillar collagens and periostin, is abnormal in CAG-CAT-Twist1;Tie2Cre mice at E17.5
Expression of ECM proteins (A, B) Col1, (C, D) Col3, and (E, F) Postn, was detected by immunofluorescence (green, arrows) in E17.5 DTG mitral valves and corresponding littermate STG controls. (G) qRT-PCR demonstrates that Col1a1, Col3a1, and Postn mRNA levels are increased in DTG versus STG (n=3) E17.5 embryos as described for Figure 4. The average base-line levels of Col1a1, Col3a1, and Postn are 1.04, 3.12, and 1.52 relative to L7 expression in E17.5 AV valves, respectively. Statistical significance is determined by Student's t- test, where * denotes p < 0.05. Scale bar represents 100 μm. IVS = interventricular septum; LV = left ventricle.
Figure 8
Figure 8. Twist1 binds directly and trans-activates a Col2a1 intronic regulatory region
(A) The mouse Col2a1 gene contains a conserved E-box sequence in region R1. Arrows indicate PCR primer sequences for amplification of R1 and of a negative control region 2 (R2), that does not contain an E-box consensus sequence. (B) The murine R1 E-box consensus sequence (CACGTG) is conserved in rat and human Col2a1 genes. E-box consensus nucleotides mutated in R1 for transfection studies are indicated by *. (C–D) ChIP assays demonstrate that Twist1 binds Col2a1 R1, but not R2 sequences, in mouse E12.5 EC (C) and MC3T3-E1 cells (D). (E) Cotransfection experiments performed in HEK293 cells demonstrate that human Col2a1 (−577 to +3428) sequences linked to a pGL2-Basic reporter are trans-activated by Twist1 (8.8-fold). Mutagenesis of the conserved R1 E-box leads to reduced trans-activation of Col2a1 regulatory sequences by Twist1. Trans-activation is represented as fold-change relative to the pcDNA empty vector control. Data are shown for a representative experiment (from n=6) performed in triplicate. Statistical significance is determined by Student's t-test, where * denotes p < 0.01.
Figure 9
Figure 9. Twist1 and Collagen 2 expression is upregulated and cell proliferation is increased in human aortic valve disease
(A, C, E, G) Human control aortic valve tissue collected at the time of autopsy. (B, D, F, H) Human diseased aortic valve tissue obtained following valve replacement surgery. (A) Movat's Pentachrome staining of normal human aortic valve tissue delineates Fibrosa (F), Spongiosa (S), and Ventricularis (V) layers. (B) Pentachrome staining of the diseased human aortic valve demonstrates disorganized stratification. The presence of calcification in the diseased human valve is apparent by von Kossa staining (D, black staining indicated by white *), in comparison to the control tissue (C). Control and diseased tissues were immunostained for Twist1 (E, F, green nuclei) and p-HH3 (E, F, red nuclei). Increased expression of Twist1 (F, green nuclei) and p-HH3 (F, red nuclei) is observed in the diseased human aortic valve tissues adjacent to areas of calcification (indicated by *) and co-localization is demonstrated by yellow nuclei (F, white arrows). In contrast, Twist1 and p-HH3 immunoreactivity is not apparent in control aortic valve tissue (E). Collagen 2 immunostaining (brown) also is increased in diseased aortic valves (arrows in H) relative to controls (G). 5/8 diseased valves analyzed have Twist1 positive immunostaining, while 1/6 control valves have Twist1 positive immunostaining. Scale bar represents 100 μm.

Similar articles

Cited by

References

    1. Aikawa E, Whittaker P, Farber M, Mendelson K, Padera RF, Aikawa M, Schoen FJ. Human semilunar cardiac valve remodeling by activated cells from fetus to adult. Circulation. 2006;113:1344–1352. - PubMed
    1. Barnes RM, Firulli AB. A twist of insight-the role of Twist-family bHLH factors in development. Int. J. Dev. Biol. 2009;53:909–924. - PMC - PubMed
    1. Cai CL, Zhou W, Yang L, Bu L, Qyang Y, Zhang X, Li X, Rosenfeld MG, Chen J, Evans S. T-box genes coordinate regional rates of proliferation and regional specification during cardiogenesis. Development. 2005;132:2475–2487. - PMC - PubMed
    1. Chakraborty S, Cheek J, Sakthivel B, Aronow BJ, Yutzey KE. Shared gene expression profiles in developing heart valves and osteoblast progenitor cells. Physiol. Genomics. 2008;35:75–85. - PMC - PubMed
    1. Combs MD, Yutzey KE. Heart valve development: Regulatory networks in development and disease. Circ. Res. 2009;105:408–421. - PMC - PubMed

Publication types

MeSH terms