Comparative Study
. 2010 Nov;91(5):727-38.
doi: 10.1016/j.exer.2010.08.022. Epub 2010 Sep 6.

Trophic factors GDNF and BDNF improve function of retinal sheet transplants

Affiliations
Comparative Study

Trophic factors GDNF and BDNF improve function of retinal sheet transplants

Pamela B Yang et al. Exp Eye Res. 2010 Nov.

Abstract

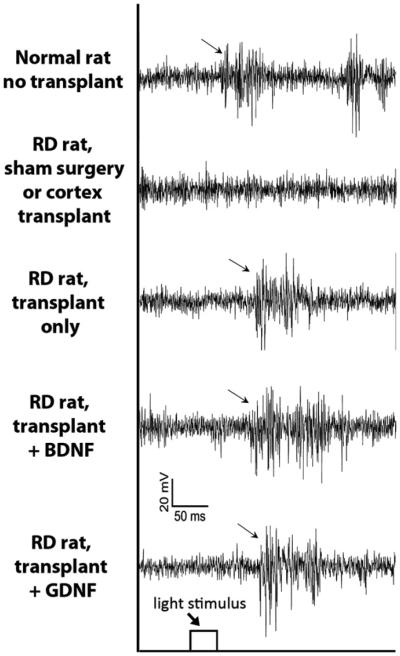
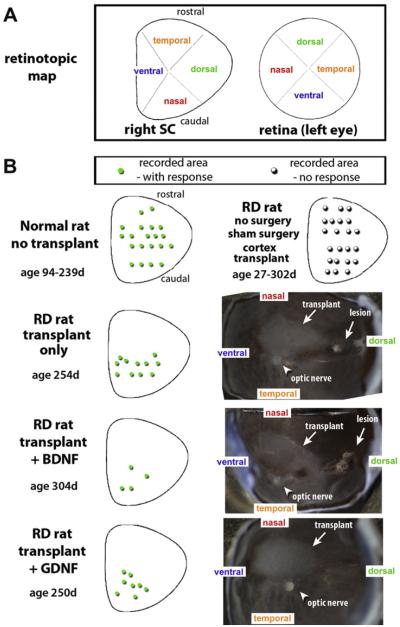
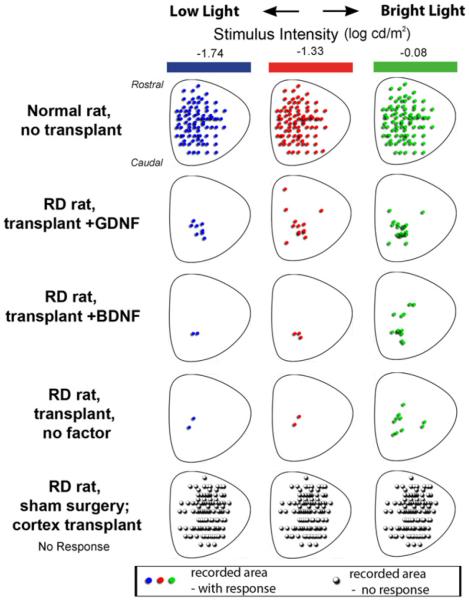
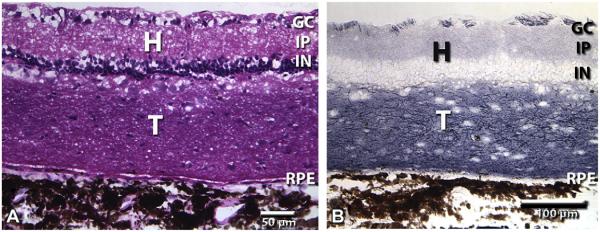
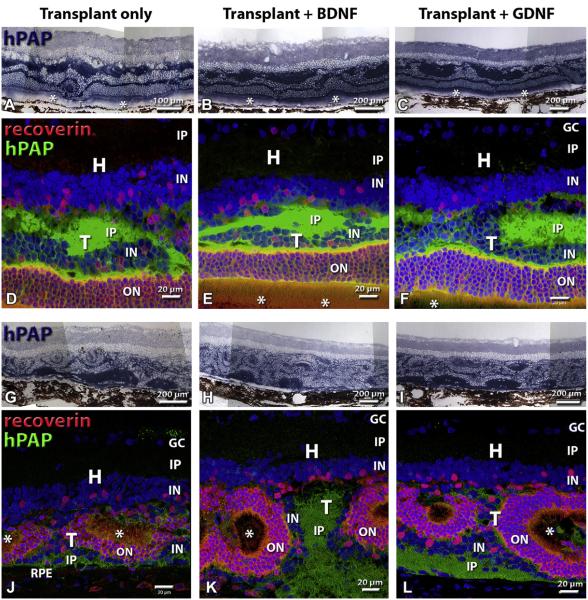
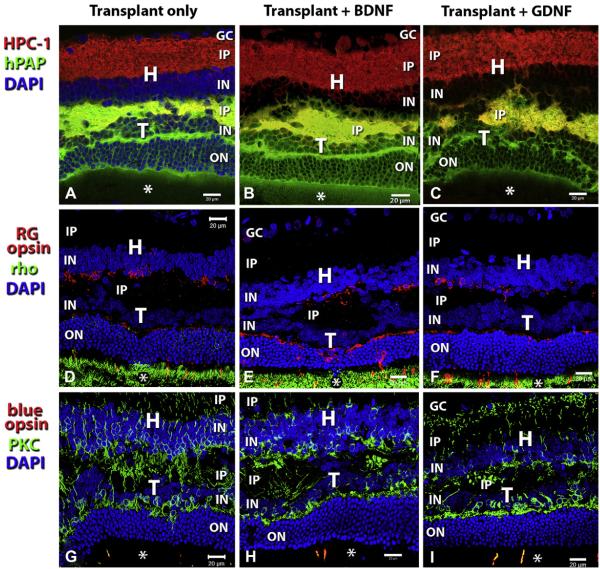
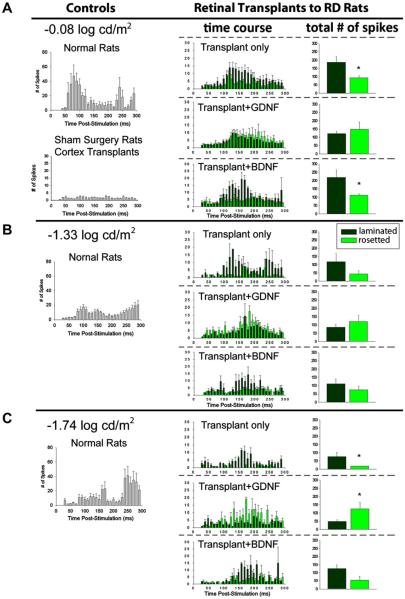
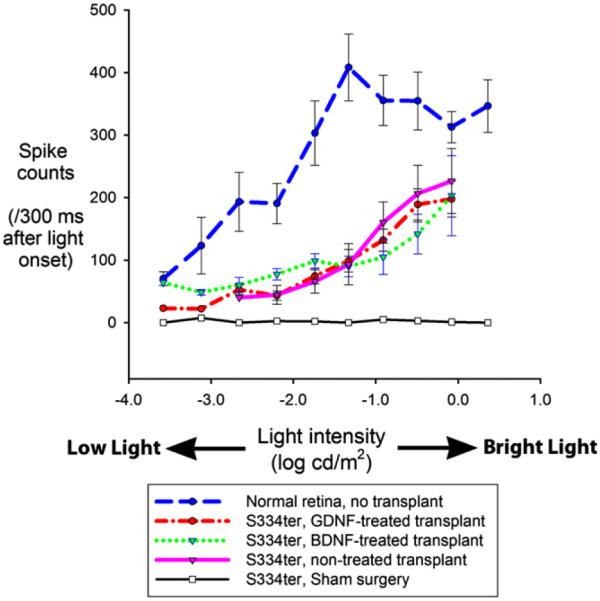
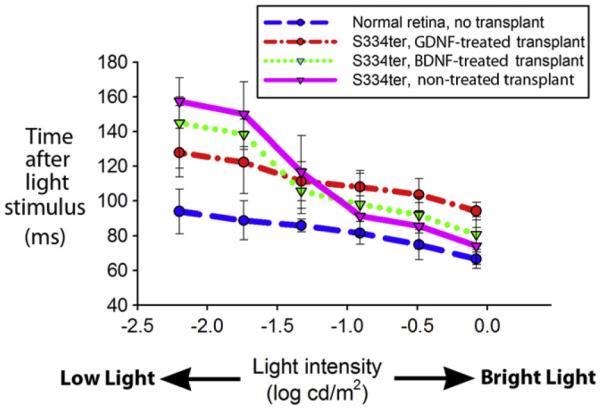
The aim of this study was to compare glial-derived neurotrophic factor (GDNF) treatment with brain-derived neurotrophic factor (BDNF) treatment of retinal transplants on restoration of visual responses in the superior colliculus (SC) of the S334ter line 3 rat model of rapid retinal degeneration (RD). RD rats (age 4-6 weeks) received subretinal transplants of intact sheets of fetal retina expressing the marker human placental alkaline phosphatase (hPAP). Experimental groups included: (1) untreated retinal sheet transplants, (2) GDNF-treated transplants, (3) BDNF-treated transplants, (4) none surgical, age-matched RD rats, (5) sham surgery RD controls, (6) progenitor cortex transplant RD controls, and (7) normal pigmented rat controls. At 2-8 months after transplantation, multi-unit visual responses were recorded from the SC using a 40 ms full-field stimulus (-5.9 to +1 log cd/m(2)) after overnight dark-adaptation. Responses were analyzed for light thresholds, spike counts, response latencies, and location within the SC. Transplants were grouped into laminated or rosetted (more disorganized) transplants based on histological analysis. Visual stimulation of control RD rats evoked no responses. In RD rats with retinal transplants, a small area of the SC corresponding to the position of the transplant in the host retina, responded to light stimulation between -4.5 and -0.08 log cd/m(2), whereas the light threshold of normal rats was at or below -5 log cd/m(2) all over the SC. Overall, responses in the SC in rats with laminated transplants had lower response thresholds and were distributed over a wider area than rats with rosetted transplants. BDNF treatment improved responses (spike counts, light thresholds and responsive areas) of rats with laminated transplants whereas GDNF treatment improved responses from rats with both laminated and rosetted (more disorganized) transplants. In conclusion, treatment of retinal transplants with GDNF and BDNF improved the restoration of visual responses in RD rats; and GDNF appears to exert greater overall restoration than BDNF.


Figures

Fig. 1
Fig. 1
Examples of recording traces from different experimental groups to a 40 ms light stimulus (stimulus level – 0.08 log cd/m2). Examples of multi-unit spike activities could be recorded in the SC of normal and rats with transplants but not in different control RD rats. Note that the response latency is longer in the transplanted rats than in the normal rat.
Fig. 2
Fig. 2
Retinotopic distribution of responses (individual experiments). (A) Diagram of retinotopic map of the right SC and the left retina. (B) Each rat was recorded over the whole extent of the SC. Normal rats: responses all over the SC (green dots); control degenerate rats: no responses (hollow black dots). In the transplanted rats (histology shown in Figs. 6A–F and 7), the location of responses in the SC to photic stimulation (green dots in diagrams in left column) corresponds to the position of the transplant in the retina (dissected eye cups, right column). For sake of clarity, transplant diagrams show only areas with responses. All eye cups were oriented along the dorso-ventral axis. Transplants appear whitish.
Fig. 3
Fig. 3
Spatial distribution of responses in the SC of normal rats (N = 10); RD rats with GDNF-treated transplants (N = 17), BDNF-treated transplants (N = 10); untreated transplants (N = 7); and sham surgery (N = 8) and cortex RD transplanted rats (N = 6) corresponding to photic stimulus intensities of −1.74 (blue dots), −1.33 (red dots) and −0.08 (green dots) log cd/m2. For sake of clarity, transplant diagrams show only areas with responses in at least one animal. For rat ages and post-surgical times see Table 1.
Fig. 4
Fig. 4
Histology of normal retina (A–C) and degenerate (RD) retina (D–F). Asterisks indicate photoreceptor outer segments. In (D–F), arrow heads indicate remaining cones in the RD retina. For explanation of label abbreviations, see abbreviation list. (A) Normal retina, hematoxylin–eosin (H–E) stain. There are 10–11 rows of nuclei in the outer nuclear layer. (B) Staining for recoverin (specific for rod and cone photoreceptors and cone bipolar cells). Nuclei are stained blue with DAPI. There is strong staining of photoreceptor somas in the outer nuclear layer, inner segments, and the photoreceptor terminal layer in the outer plexiform layer. (C) Staining for red-green opsin (RG opsin) in cone outer segments in normal retina. (D) RD retina, sham surgery, age 289 d (H–E staining). (E) Recoverin staining of RD host retina outside transplant area (retina + GDNF transplant, age 250 d). Cone bipolar cells in the inner nuclear layer are more intensely stained than residual cones. (F) RG opsin staining of residual cones in RD host retina outside transplant area (retina only transplant, age 254 d). Magnification bars: 50 μm (A, D); 20 μm (B, C, E, F). All images are oriented with the ganglion cell layer up and the RPE layer down.
Fig. 5
Fig. 5
Cortex transplant, 81 d after surgery, age 106 d. No response. (A) H–E staining. (B) hPAP staining (blue-purple). Host ganglion cell axons at the vitreal surface of the retina apparently have been myelinated by transplant-derived oligodendrocytes. Magnification bars: 50 μm (A), 100 μm (B).
Fig. 6
Fig. 6
Comparison of laminated and rosetted transplants. Asterisks (*) indicate photoreceptor outer segments. A, B, C, G, H, I: overview, hPAP staining of transplant (blue-purple). D, E, F, J, K, L: Enlargements; green staining for rabbit anti hPAP (marker for donor cells) in combination with mouse anti recoverin (red). Recoverin stains all photoreceptors and cone bipolar cells. Note that the host retina contains few cone photoreceptors on all images. Nuclei are counterstained blue with DAPI. (A)-(F) Examples of laminated transplants. (A), (D) Non-treated retinal transplant, age 254 d. This rat had responses in 11 areas at bright light; the threshold for visual responses in the SC was at −2.2 log cd/m2. (B), (E) BDNF-treated transplant, age 304 d; threshold −3.6 log cd/m2; responses in 5 areas in bright light. (C), (F) GDNF-treated transplant, age 250 d; threshold −1.7 log cd/m2; responses in 8 areas in bright light. (G)–(L) Examples of rosetted transplants. (G), (J) Non-treated retinal-transplant, age 260 d. This rat had only faint responses in bright light (−0.91 log cd/m2). (H), (K) BDNF-treated transplant, age 93 d; threshold −1.1 log cd/m2, response in 4 areas in bright light. (I), (L) GDNF-treated transplant; age 131 d; threshold −2.4 log cd/m2, responses in 9 areas in bright light. Magnification bars: 100 μm (A); 200 μm (B, C, G–I); 20 μm (D–F, J–L). All images are oriented with the ganglion cell layer up and the RPE layer down.
Fig. 7
Fig. 7
Analysis of 3 different laminated transplants (same transplants as Fig. 6A–F). Each column shows images of the same transplant, stained for antibodies indicated on the left side. All images are projection stacks of confocal images taken at several different focus levels. In (A), (D)–(I), nuclei are counterstained with DAPI (blue). Photoreceptor outer segments are indicated by asterisks. (A)–(C) Rabbit anti hPAP (green) in combination with mouse HPC-1 (anti-Syntaxin-1, red). HPC-1 stains synaptic layers and, more faintly, the cytoplasm of amacrine cells in the inner nuclear layer. The DAPI stain has been omitted from (B) and (C) so that the amacrine cell staining can be seen. (D)–(F) rabbit anti red-green opsin (red) in combination with mouse anti-rhodopsin (green). Strong staining of transplant outer segments for rhodopsin. Note that there is no rhodopsin staining in the host retina although there are scattered cell bodies of host cones at the transplant-host interface. Cone outer segments can only be seen in the transplant. Cone opsin also stains cone terminals in the outer plexiform layer of the transplant and processes of host cones in the host outer plexiform layer. (G)–(I) Combination of rabbit anti blue opsin (red) with mouse anti PKC (green) which stains rod bipolar cells and blue cones. Outer segments of blue cones (very few) can only be seen in the transplant. PKC staining of bipolar cells is stronger in the transplant than in the host retina (best seen in I). Scale bars = 20 μm.
Fig. 8
Fig. 8
Difference of response patterns in SC between experimental groups at 3 light intensities, showing a difference in mechanism of action between BDNF and GDNF (analysis of spike counts within 300 ms after light stimulus). RD rats with retinal transplants (middle and right column) were compared to normal and control RD rats (left column) at −0.08, −1.33 and −1.74 log cd/m2 photic stimulation. Results of laminated and rosetted transplants are shown separately. The left and middle columns show spike counts for every 20 ms within 300 ms after light stimulus. The right column shows the total number of spikes within 300 ms. Laminated transplants without treatment and with BDNF treatment show higher spike counts than rosetted transplants within the same treatment group. In the GDNF-treated group, there is a trend towards higher spike counts in the rosetted transplant group at luminances of −0.08 and −1.33 log cd/m2; and a significantly higher spike count in the rosetted transplant group at a luminance of −1.74 log cd/m2. * indicates a significant difference, p < 0.05.
Fig. 9
Fig. 9
Response functions (total spike counts within 300 ms after stimulus) of normal rats (blue), RD rats with GDNF-treated (red), BDNF-treated (green) and untreated transplants (purple), and sham surgery RD rats (black).
Fig. 10
Fig. 10
The response onset latency of normal rats (blue), rats with GDNF-treated transplants (red), rats with BDNF-treated transplants (green), and rats with untreated transplants (purple). At the lowest luminances, GDNF and BDNF-treated transplants have shorter latencies than untreated transplants. Time zero on the Y-axis is the electrical signal to the camera shutter.

Similar articles

Cited by

References

    1. Aramant RB, Seiler MJ. Retinal transplantation – advantages of intact fetal sheets. Prog. Retin. Eye Res. 2002;21:57–73. - PubMed
    1. Aramant RB, Seiler MJ. Progress in retinal sheet transplantation. Prog. Retin. Eye Res. 2004;23:475–494. - PubMed
    1. Barnstable CJ, Hofstein R, Akagawa K. A marker of early amacrine cell development in rat retina. Brain Res. 1985;352:286–290. - PubMed
    1. Berardi N, Maffei L. The visual neurosciences. In: Chalupa LM, Werner JS, editors. Neurotrophins. Electrical Activity and the Development of Visual Function. Vol. 1. MIT Press; 2004.
    1. Berson EL, Rosner B, Weigel-DiFranco C, Dryja TP, Sandberg MA. Disease progression in patients with dominant retinitis pigmentosa and rhodopsin mutations. Invest. Ophthalmol. Vis. Sci. 2002;43:3027–3036. - PubMed

Publication types

MeSH terms

Substances