

Limited beneficial effects of perfluorocarbon emulsions on encapsulated cells in culture: experimental and modeling studies
- PMID: 20804794
- PMCID: PMC2962717
- DOI: 10.1016/j.jbiotec.2010.08.013
Limited beneficial effects of perfluorocarbon emulsions on encapsulated cells in culture: experimental and modeling studies
Abstract
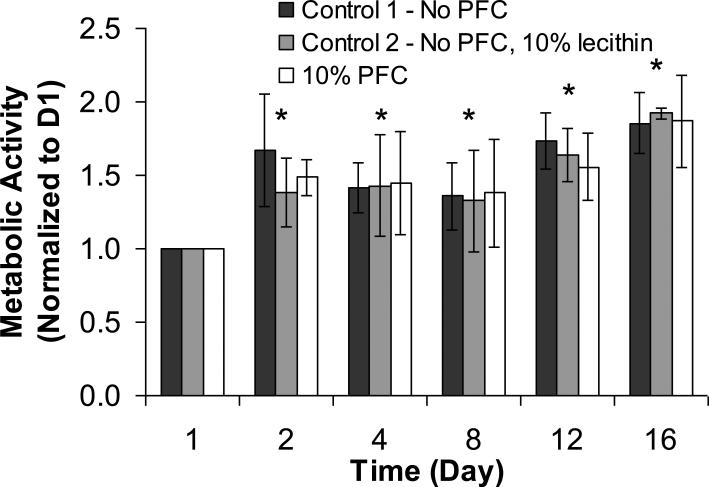
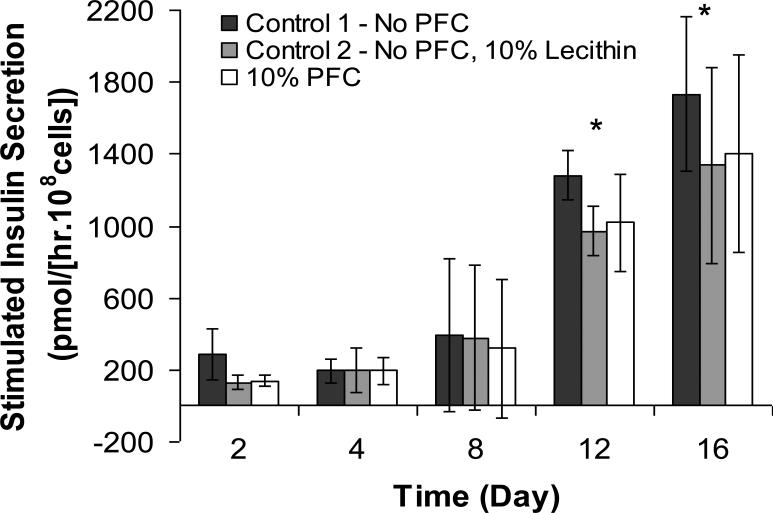
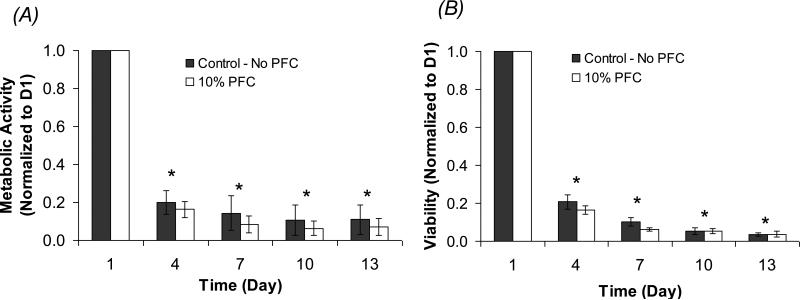
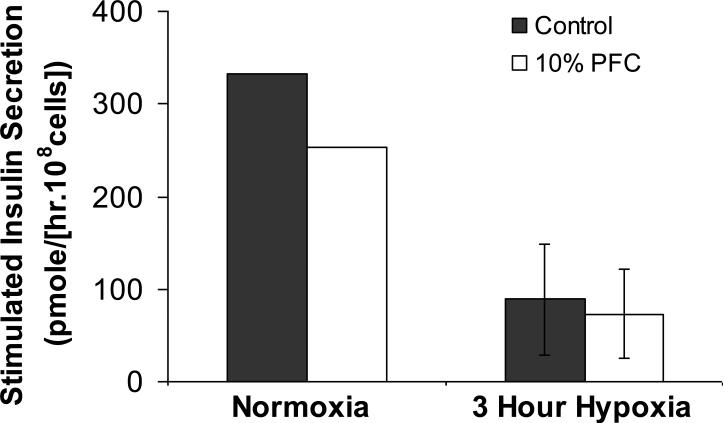
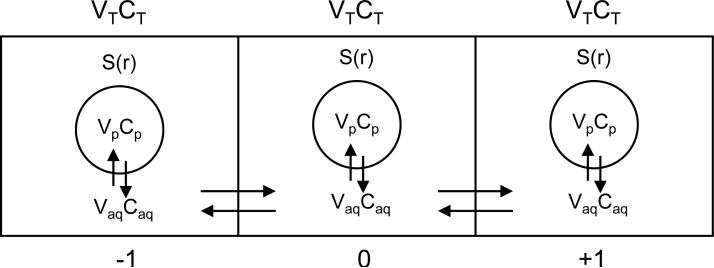
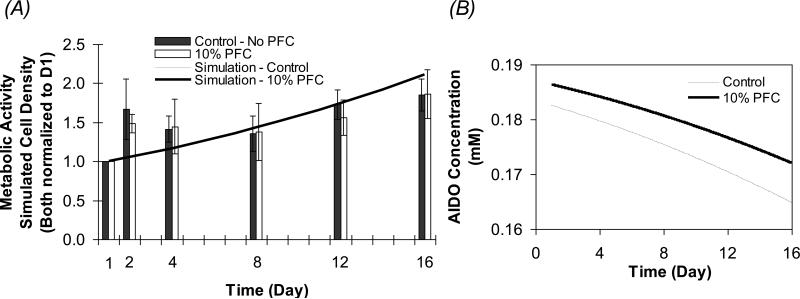
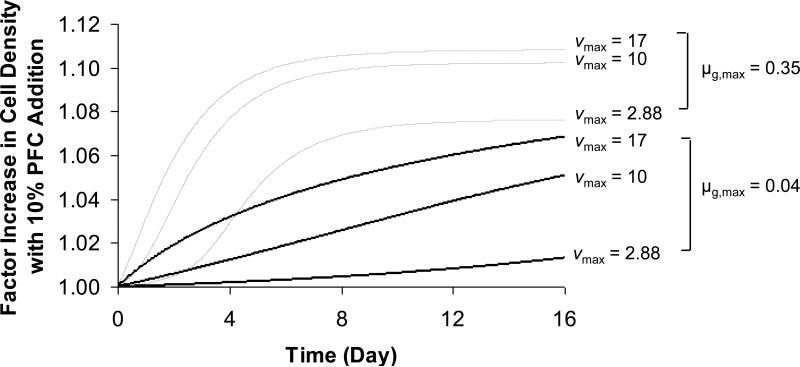
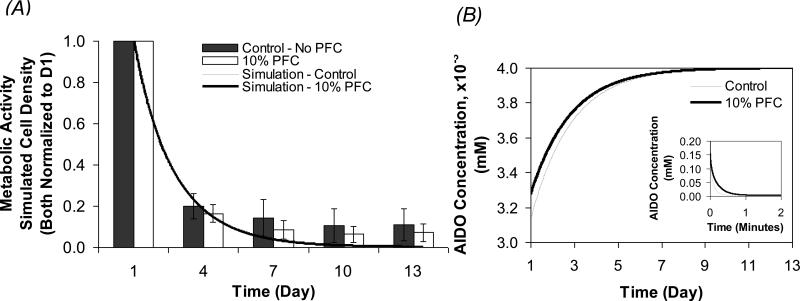
Due to the high solubility of oxygen in perfluorocarbons (PFCs), these compounds have been explored for improved cell and tissue oxygenation. The goal of this study is to investigate the effects of a PFC emulsion on cellular growth and function in a tissue engineered construct. A perfluorotributylamine (PFTBA) emulsion was co-encapsulated at 10 vol% with mouse βTC-tet insulinoma cells in calcium alginate beads and cultured under normoxic and severely hypoxic conditions. The number of metabolically active cells and the induced insulin secretion rate were measured over time for up to 16 days. Results showed no significant effect of PFTBA relative to the PFTBA-free control. The alginate-PFC-cell system was also modeled mathematically, and simulations tracked the number of viable cells over time under the same conditions used experimentally. Simulations revealed only a small, likely experimentally undetectable difference in cell density between the PFC-containing and PFC-free control beads. It is concluded that PFTBA up to 10 vol% has no significant effect on the growth and function of encapsulated βTC-tet cells under normoxic and hypoxic conditions.
Copyright © 2010 Elsevier B.V. All rights reserved.
Figures
Similar articles
-
Dual perfluorocarbon method to noninvasively monitor dissolved oxygen concentration in tissue engineered constructs in vitro and in vivo.Biotechnol Prog. 2011 Jul;27(4):1115-25. doi: 10.1002/btpr.619. Epub 2011 May 23. Biotechnol Prog. 2011. PMID: 21608139
-
Oxygenated environment enhances both stem cell survival and osteogenic differentiation.Tissue Eng Part A. 2013 Mar;19(5-6):748-58. doi: 10.1089/ten.TEA.2012.0298. Epub 2013 Jan 4. Tissue Eng Part A. 2013. PMID: 23215901
-
The effect of synthetic oxygen carrier-enriched fibrin hydrogel on Schwann cells under hypoxia condition in vitro.Biomaterials. 2013 Dec;34(38):10016-27. doi: 10.1016/j.biomaterials.2013.09.047. Epub 2013 Oct 1. Biomaterials. 2013. PMID: 24095255
-
Perfluorocarbon emulsions and cardiopulmonary bypass: a technique for the future.J Cardiothorac Vasc Anesth. 1996 Jan;10(1):83-89; quiz 89-90. doi: 10.1016/s1053-0770(96)80182-0. J Cardiothorac Vasc Anesth. 1996. PMID: 8634391 Review.
-
Understanding the fundamentals of perfluorocarbons and perfluorocarbon emulsions relevant to in vivo oxygen delivery.Artif Cells Blood Substit Immobil Biotechnol. 2005;33(1):47-63. doi: 10.1081/bio-200046659. Artif Cells Blood Substit Immobil Biotechnol. 2005. PMID: 15768565 Review.
Cited by
-
A bioinspired scaffold for rapid oxygenation of cell encapsulation systems.Nat Commun. 2021 Oct 6;12(1):5846. doi: 10.1038/s41467-021-26126-w. Nat Commun. 2021. PMID: 34615868 Free PMC article.
-
Oxygen Regulation in Development: Lessons from Embryogenesis towards Tissue Engineering.Cells Tissues Organs. 2018;205(5-6):350-371. doi: 10.1159/000493162. Epub 2018 Oct 1. Cells Tissues Organs. 2018. PMID: 30273927 Free PMC article. Review.
-
Oxygen and Drug-Carrying Periodic Mesoporous Organosilicas for Enhanced Cell Viability under Normoxic and Hypoxic Conditions.Int J Mol Sci. 2022 Apr 14;23(8):4365. doi: 10.3390/ijms23084365. Int J Mol Sci. 2022. PMID: 35457183 Free PMC article.
-
Trichostatin A affects the secretion pathways of beta and intestinal endocrine cells.Exp Cell Res. 2015 Jan 1;330(1):212-21. doi: 10.1016/j.yexcr.2014.09.031. Epub 2014 Oct 16. Exp Cell Res. 2015. PMID: 25305500 Free PMC article.
-
Fluorinated Chitosan Microgels to Overcome Internal Oxygen Transport Deficiencies in Microtissue Culture Systems.Adv Biosyst. 2020 Aug;4(8):e1900250. doi: 10.1002/adbi.201900250. Epub 2020 Jul 19. Adv Biosyst. 2020. PMID: 32686345 Free PMC article.
References
-
- Atias S, Mizrahi SS, Shaco-Levy R, Yussim A. Preservation of pancreatic tissue morphology, viability and energy metabolism during extended cold storage in two-layer oxygenated University of Wisconsin/perfluorocarbon solution. Isr Med Assoc J. 2008;10(4):273–6. - PubMed
-
- Benson JP, Papas KK, Constantinidis I, Sambanis A. Towards the development of a bioartificial pancreas: effects of poly-L-lysine on alginate beads with BTC3 cells. Cell Transplant. 1997;6(4):395–402. - PubMed
-
- Bergert H, Knoch KP, Meisterfeld R, Jager M, Ouwendijk J, Kersting S, Saeger HD, Solimena M. Effect of oxygenated perfluorocarbons on isolated rat pancreatic islets in culture. Cell Transplant. 2005;14(7):441–8. - PubMed
-
- Caballero-Corbalan J, Eich T, Lundgren T, Foss A, Felldin M, Kallen R, Salmela K, Tibell A, Tufveson G, Korsgren O, others No beneficial effect of two-layer storage compared with UW-storage on human islet isolation and transplantation. Transplantation. 2007;84(7):864–9. - PubMed
Publication types
MeSH terms
Substances
Grants and funding
LinkOut - more resources
Full Text Sources
Other Literature Sources
Miscellaneous
