

Effects of physiological noise in population analysis of diffusion tensor MRI data
- PMID: 20804850
- PMCID: PMC2997122
- DOI: 10.1016/j.neuroimage.2010.08.048
Effects of physiological noise in population analysis of diffusion tensor MRI data
Abstract
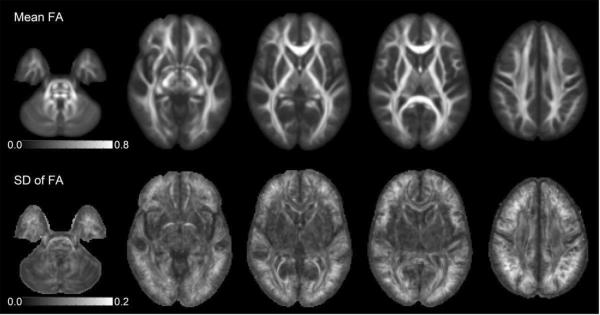
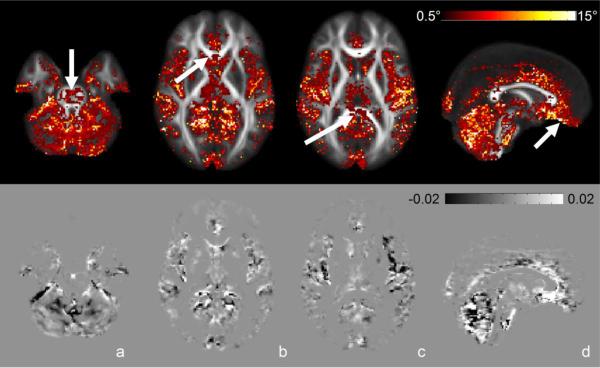
The goal of this study is to characterize the potential effect of artifacts originating from physiological noise on statistical analysis of diffusion tensor MRI (DTI) data in a population. DTI derived quantities including mean diffusivity (Trace(D)), fractional anisotropy (FA), and principal eigenvector (ε(1)) are computed in the brain of 40 healthy subjects from tensors estimated using two different methods: conventional nonlinear least-squares, and robust fitting (RESTORE). RESTORE identifies artifactual data points as outliers and excludes them on a voxel-by-voxel basis. We found that outlier data points are localized in specific spatial clusters in the population, indicating a consistency in brain regions affected across subjects. In brain parenchyma RESTORE slightly reduces inter-subject variance of FA and Trace(D). The dominant effect of artifacts, however, is bias. Voxel-wise analysis indicates that inclusion of outlier data points results in clusters of under- and over-estimation of FA, while Trace(D) is always over-estimated. Removing outliers affects ε(1) mostly in low anisotropy regions. It was found that brain regions known to be affected by cardiac pulsation - cerebellum and genu of the corpus callosum, as well as regions not previously reported, splenium of the corpus callosum-show significant effects in the population analysis. It is generally assumed that statistical properties of DTI data are homogenous across the brain. This assumption does not appear to be valid based on these results. The use of RESTORE can lead to a more accurate evaluation of a population, and help reduce spurious findings that may occur due to artifacts in DTI data.
Published by Elsevier Inc.
Figures


References
-
- Barry RL, Menon RS. Modeling and suppression of respiration-related physiological noise in echo-planar functional magnetic resonance imaging using global and one-dimensional navigator echo correction. Magn Reson Med. 2005;54(2):411–8. - PubMed
-
- Basser PJ, Mattiello J, LeBihan D. Estimation of the effective self-diffusion tensor from the NMR spin echo. J Magn Reson B. 1994;103(3):247–54. - PubMed
-
- Bevington P. Data Reduction and Error Analysis for the Physical Sciences. McGraw-Hill Book Company; New York, NY: 1969.
-
- Chang L-C, Jones DK, Pierpaoli C. RESTORE: robust estimation of tensors by outlier rejection. Magn Reson Med. 2005;53(5):1088–95. - PubMed
Publication types
MeSH terms
Grants and funding
LinkOut - more resources
Full Text Sources
