. 2010 Sep 3;7(3):380-90.
doi: 10.1016/j.stem.2010.07.011.

The distinct metabolic profile of hematopoietic stem cells reflects their location in a hypoxic niche

Affiliations

The distinct metabolic profile of hematopoietic stem cells reflects their location in a hypoxic niche

Tugba Simsek et al. Cell Stem Cell. .

Abstract

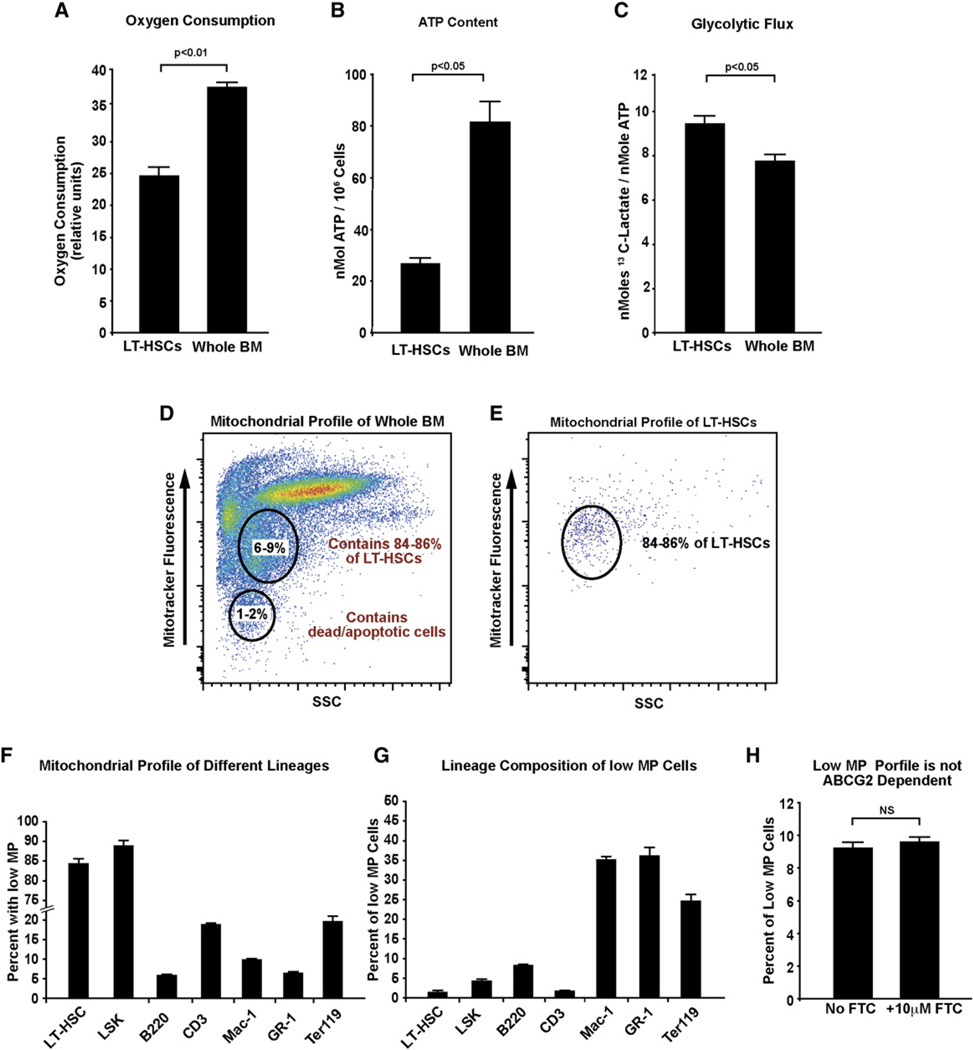
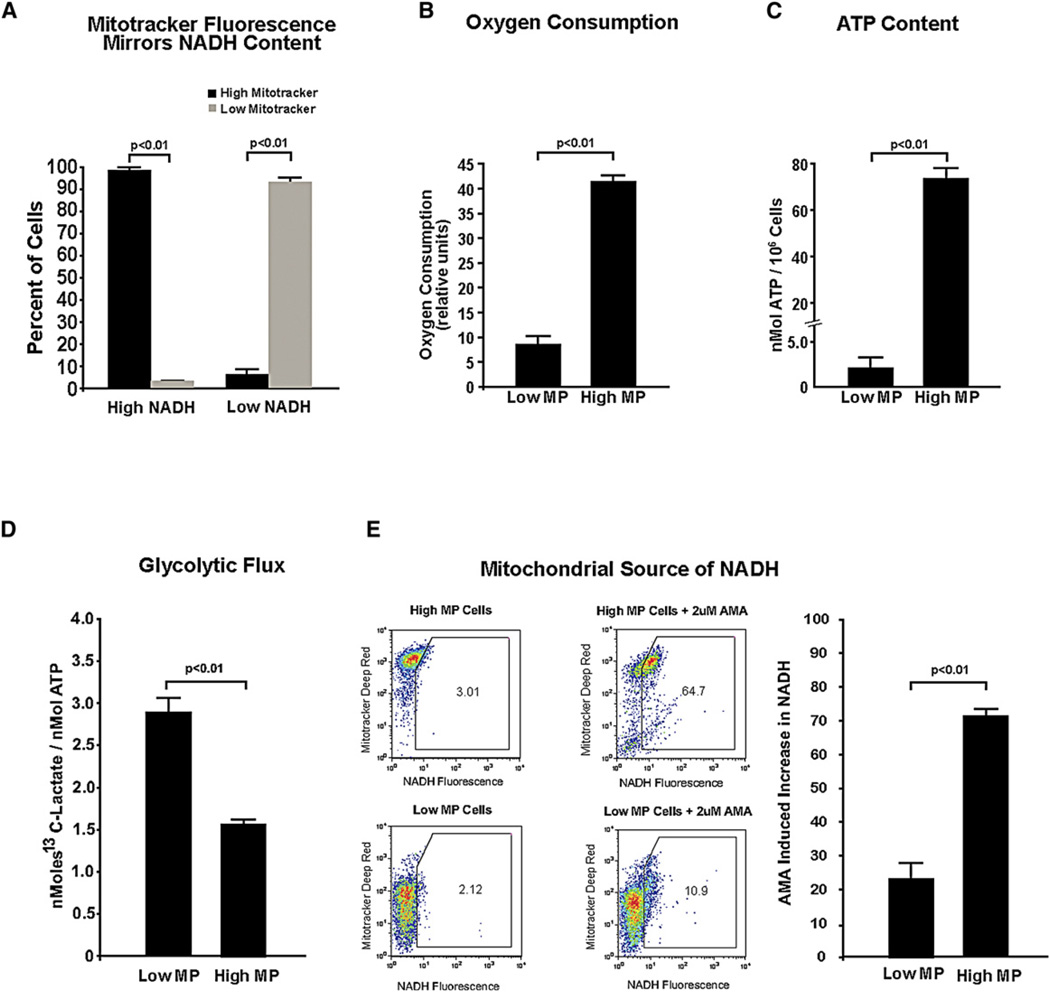
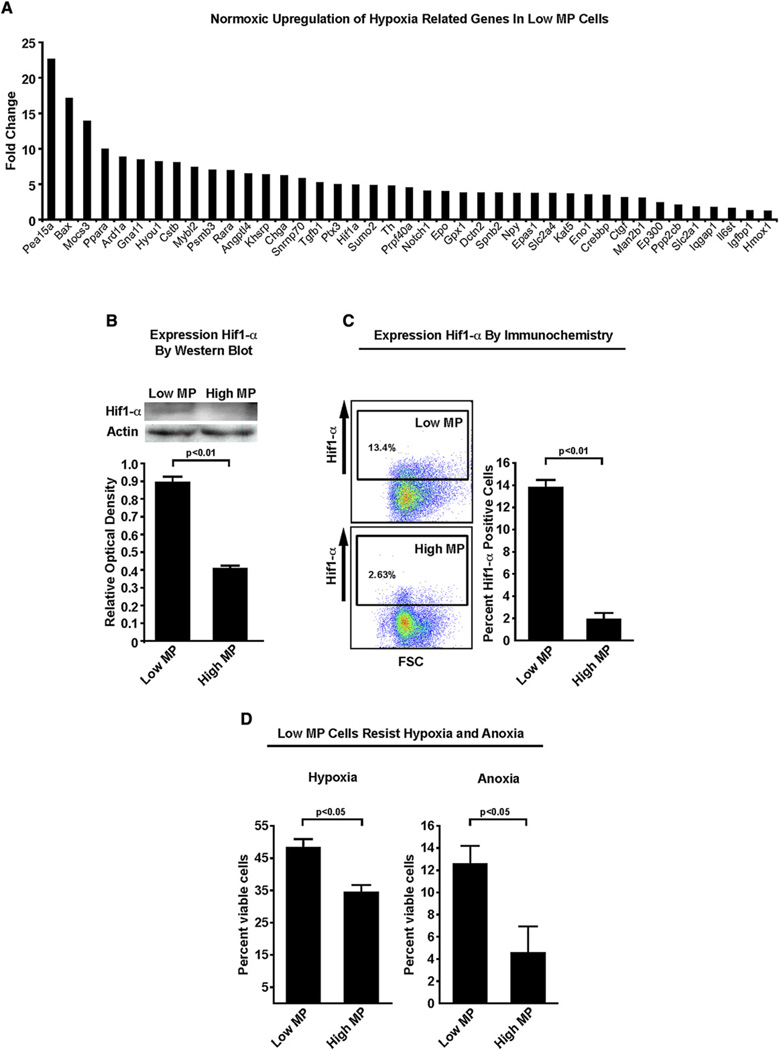
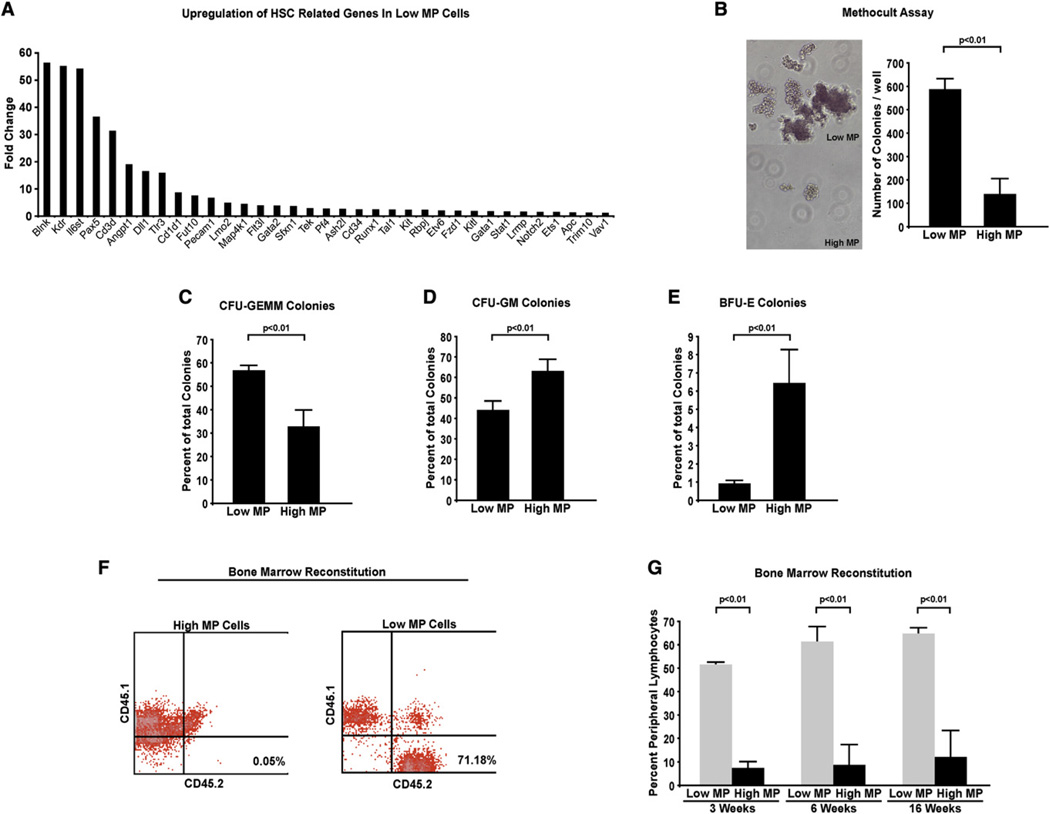
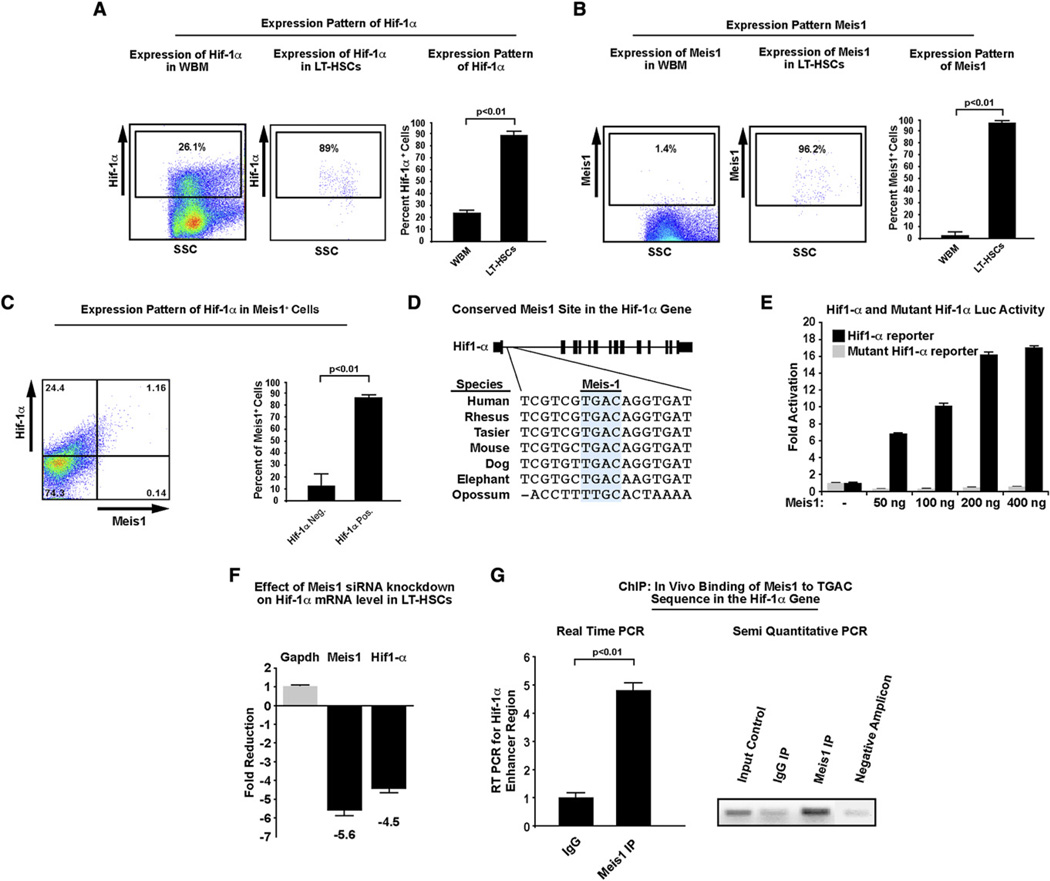
Bone marrow transplantation is the primary therapy for numerous hematopoietic disorders. The efficiency of bone marrow transplantation depends on the function of long-term hematopoietic stem cells (LT-HSCs), which is markedly influenced by their hypoxic niche. Survival in this low-oxygen microenvironment requires significant metabolic adaptation. Here, we show that LT-HSCs utilize glycolysis instead of mitochondrial oxidative phosphorylation to meet their energy demands. We used flow cytometry to identify a unique low mitochondrial activity/glycolysis-dependent subpopulation that houses the majority of hematopoietic progenitors and LT-HSCs. Finally, we demonstrate that Meis1 and Hif-1alpha are markedly enriched in LT-HSCs and that Meis1 regulates HSC metabolism through transcriptional activation of Hif-1alpha. These findings reveal an important transcriptional network that regulates HSC metabolism.


Figures

Figure 1
Figure 1. Metabolic Profile of Mouse HSCs
(A) Oxygen consumption of Lin, SCA-1+, c-Kit+, CD34, and Flk2 cells (LT-HSCs) and whole bone marrow demonstrating lower rates of oxygen consumption by LT-HSCs (n = 3). (B) ATP level of LT-HSCs and whole bone marrow demonstrating lower ATP levels in LT-HSCs (n = 3). (C) Glycolytic flux of LT-HSCs and whole bone marrow demonstrating higher rates of glycolysis in LT-HSCs (n = 3). (D) Flow cytometry profile of whole mouse bone marrow stained with mitotracker. Note the distinct populations with different mitotracker fluorescence. (E) Mitotracker profile of LT-HSCs. The majority of LT-HSCs (84%–86%) are localized to a distinct population (6%–9% of total bone marrow cells) with low mitochondrial potential (MP cells). (F) Mitotracker profile of different bone marrow lineages. Note that whereas the majority of LT-HSCs and LSK cells are localized to the low mitochondrial potential gate, the majority of all other lineages have high mitochondrial potential (n = 4). (G) Lineage composition of the low MP cells. Note that whereas the low MP gate is markedly enriched in LT-HSCs and LSK cells, it also contains all other bone marrow lineages (n = 4). (H) Percentage of cells in the low MP gate following pretreatment with FTC (a specific blocker of the ABCG2 transporter). Note that FTC had no effect on the percentage of cells in the low MP gate (n = 3). This indicates that the low MP profile is not secondary to dye efflux. Data presented as mean ± SEM.
Figure 2
Figure 2. Low MP Cells Are Glycolytic
(A) Comparison between mitotracker fluorescence and endogenous NADH fluorescence of both high MP and low MP cells. Note the direct correlation between mitotracker fluorescence and NADH fluorescence, which provides further proof of the metabolic state of these two populations (n = 4). (B) Oxygen consumption of high and low MP cells. Note the significantly lower rates oxygen consumption in the low MP cells (n = 3). (C) ATP content of high and low MP cells demonstrating a significantly lower levels of ATP in the low MP cells (n = 3). (D) Measurement of glycolytic flux of high and low MP cells as determined by 13C-Lactate production. The low MP cells displayed significantly higher rates of glycolysis/nMol ATP compared to the high MP cells (n = 3). (E) Determination of cellular source of NADH: flow cytometry profiles of high (upper) and low (lower) MP cells before (left) and after (right) treatment with antimycin A (AMA). Note the significant shift of most of the high MP cells after AMA treatment (upper right panel) and the minimal shift of low MP cells in response to AMA (lower right panel). The bar graph shows quantification of the percentage of cells with increased NADH fluorescence in response to AMA (n = 3). This indicates that the majority of NADH in the low MP cells is derived from nonmitochondrial source(s). Data presented as mean ± SEM.
Figure 3
Figure 3. Normoxic Upregulation of Hif-1α in Low MP Cells
(A) Hypoxia real-time PCR array profile of low MP cells compared to high MP cells. Note the significant normoxic upregulation of hypoxia inducible genes in low MP cells under normoxic conditions (5–6 hr after isolation). (B) Upper panel(s) show western blot analysis of high and low MP cells with Hif-1α antibody and actin as loading control. The lower panel shows densitometry analysis demonstrating higher Hif-1α protein expression in the low MP cells (n = 3). (C) Immunocytochemistry staining demonstrating a higher percentage of low MP cells expressing Hif-1α compared to high MP cells (n = 3). (D) Viability of low and high MP cells followed low-oxygen stress. The left panel shows the percentage of viable low and high MP cells after 12 hr of severe (1%) hypoxia. The right panel shows the percentage of viable low and high MP cells after 12 hr of anoxia (n = 3). Viability was assessed with trypan blue. Note the significantly higher viability in the low MP population after both hypoxia and anoxia. Data presented as mean ± SEM. See also Figure S2.
Figure 4
Figure 4. Low MP Cells Are Enriched for HSCs
(A) PCR array profile of low MP cells compared to high MP cells demonstrating enrichment of a number of HSCs associated genes in the low MP population. (B) The left panel shows a representative bright field microscopic image of colonies obtained from low and high MP cells. The right panel shows quantification of colonies derived from low and high MP cells in methocult after 12 days. (C) GFU-GEMM colonies. (D) CFU-GM colonies. (E) BFU-E colonies (n = 3). Note the significantly higher number of colonies derived from the low MP population. These results indicate that the low MP population is markedly enriched for hematopoietic progenitor cells. (F) Representative flow cytometry profiles of peripheral blood of bone marrow recipient mice after staining with anti-CD45.2-FITC antibody (x axis) and anti-CD45.1-PE antibody (y axis), demonstrating higher engraftment in the recipient of low MP cells. (G) Time course analysis of bone marrow reconstitution with low and high MP cells (n = 5 animals/group). Note the significantly higher bone marrow repopulation capacity of the low MP cells at all time points. This result indicates that the low MP population is enriched for long term repopulating HSCs. Data presented as mean ± SEM. See also Figure S1.
Figure 5
Figure 5. Transcriptional Regulation of Hif-1α by Meis1
(A) Expression pattern of Hif-1α. The left panel shows expression of Hif-1α in WBC. The middle panel shows expression of Hif-1α in LT-HSCs. The right panel shows quantification of Hif-1α expression. Note that whereas less than 25% of the unfractionated bone marrow cells express Hif-1α, the vast majority of LT-HSCs express Hif-1α protein (n = 3). (B) Expression pattern of Meis1. The left panel shows expression of Meis1 in WBM. The middle panel shows expression of Meis1 in LT-HSCs. The right panel shows quantification of Meis1 expression. Note that whereas less than 2% of the unfractionated bone marrow cells express Meis1, almost all the LT-HSCs express Meis1 protein (n = 3). (C) Colocalization of Hif-1α and Meis1 in the WBM. The left panel shows a representative flow cytometry profile of the expression of Hif-1α and Meis1. The right panel shows quantification of Hif-1α and Meis1 expression. Note that although only a small percentage of WBM cells express Meis1, the majority of these Meis1+ cells also coexpress Hif-1α (n = 3). (D) Schematic of the conserved Meis1 binding domain in the first intronic region Hif-1α. (E) Luciferase assay demonstrating dose dependent increase in Hif-1α luciferase activity after transfection with Meis1 expression vector. Mutation of the four nucleotides Meis1 seed region completely abolishes the luciferase activity (n = 3). (F) Real-time PCR following siRNA knockdown of Meis1 in freshly isolated LT-HSCs. Knockdown of Meis1 in LT-HSCs (5.6-fold) resulted in marked downregulation of Hif-1α mRNA levels (4.5-fold), (n = 3). (G) ChIP assay demonstrating in vivo binding of Meis1 to its consensus binding sequence in the Hif1-α first intron. The left panel shows real-time PCR with primers flanking the consensus Meis1 binding sequence compared to control IgG after immunoprecipitation. The right panel shows PCR products showing input control and negative amplicon (n = 3). Data presented as mean ± SEM. See also Figure S2.

Comment in

Similar articles

Cited by

References

    1. Argiropoulos B, Yung E, Humphries RK. Unraveling the crucial roles of Meis1 in leukemogenesis and normal hematopoiesis. Genes Dev. 2007;21:2845–2849. - PubMed
    1. Azcoitia V, Aracil M, Martínez-A C, Torres M. The homeodomain protein Meis1 is essential for definitive hematopoiesis and vascular patterning in the mouse embryo. Dev. Biol. 2005;280:307–320. - PubMed
    1. Belaiba RS, Bonello S, Zähringer C, Schmidt S, Hess J, Kietzmann T, Görlach A. Hypoxia up-regulates hypoxia-inducible factor-1alpha transcription by involving phosphatidylinositol 3-kinase and nuclear factor kappaB in pulmonary artery smooth muscle cells. Mol. Biol. Cell. 2007;18:4691–4697. - PMC - PubMed
    1. Blouin CC, Pagé EL, Soucy GM, Richard DE. Hypoxic gene activation by lipopolysaccharide in macrophages: Implication of hypoxia-inducible factor 1alpha. Blood. 2004;103:1124–1130. - PubMed
    1. Bradley TR, Hodgson GS, Rosendaal M. The effect of oxygen tension on haemopoietic and fibroblast cell proliferation in vitro. J. Cell. Physiol. 1978;97(3 Pt 2) Suppl 1:517–522. - PubMed

Publication types

Substances