. 2010 Nov 5;285(45):34447-59.
doi: 10.1074/jbc.M110.133579. Epub 2010 Aug 30.

The antioxidant transcription factor Nrf2 negatively regulates autophagy and growth arrest induced by the anticancer redox agent mitoquinone

Affiliations

The antioxidant transcription factor Nrf2 negatively regulates autophagy and growth arrest induced by the anticancer redox agent mitoquinone

V Ashutosh Rao et al. J Biol Chem. .

Abstract

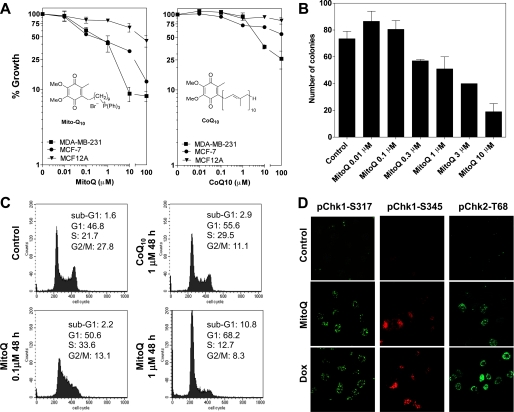
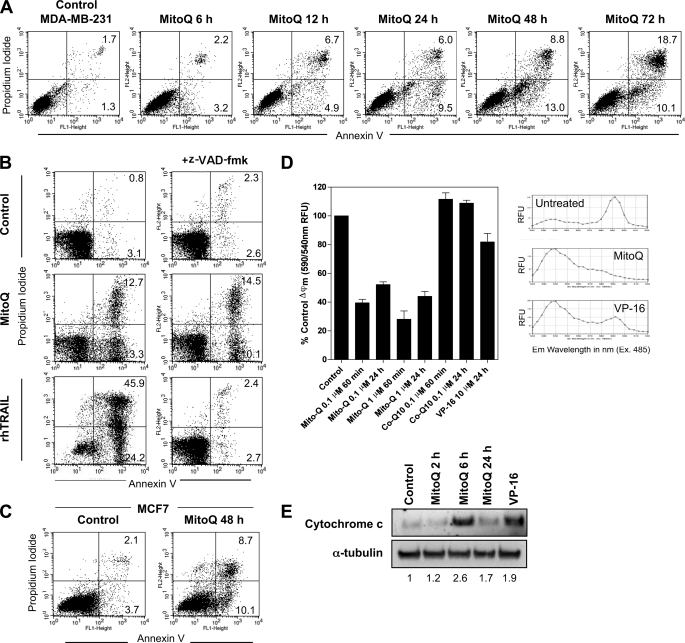
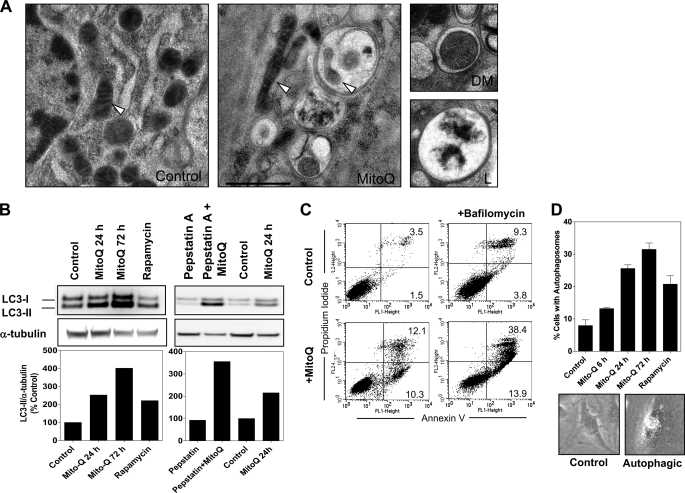
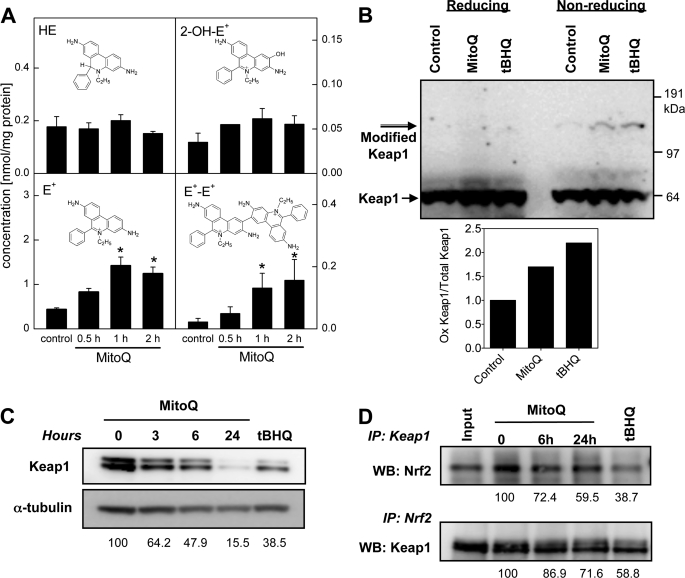
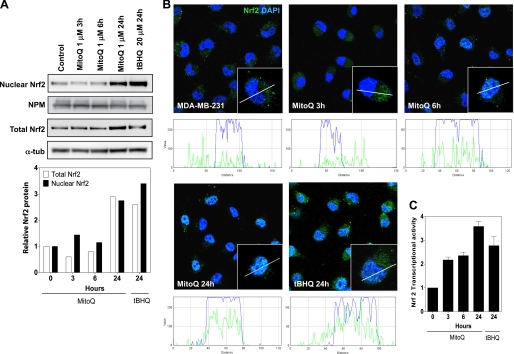
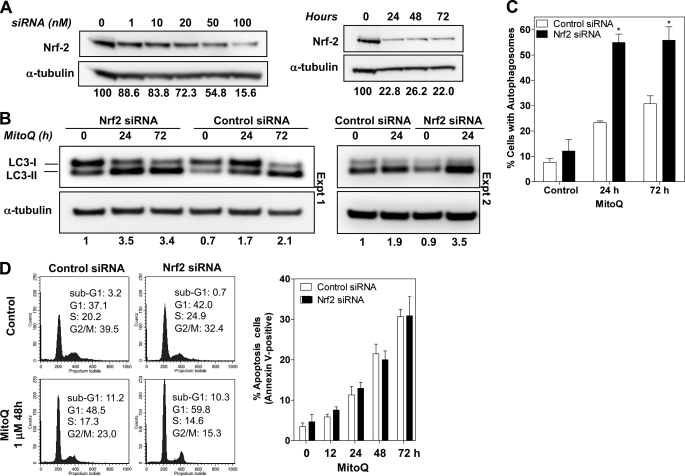
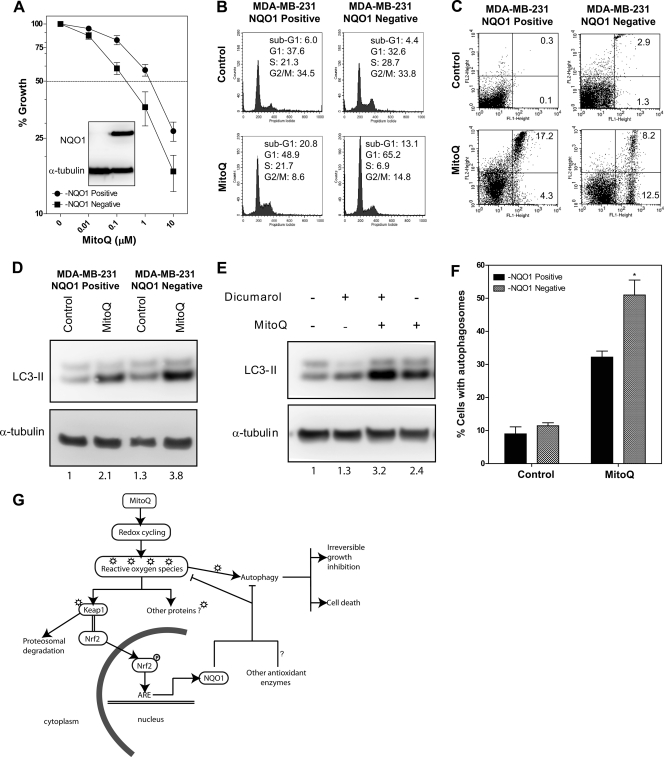
Mitoquinone (MitoQ) is a synthetically modified, redox-active ubiquinone compound that accumulates predominantly in mitochondria. We found that MitoQ is 30-fold more cytotoxic to breast cancer cells than to healthy mammary cells. MitoQ treatment led to irreversible inhibition of clonogenic growth of breast cancer cells through a combination of autophagy and apoptotic cell death mechanisms. Relatively limited cytotoxicity was seen with the parent ubiquinone coenzyme Q(10.) Inhibition of cancer cell growth by MitoQ was associated with G(1)/S cell cycle arrest and phosphorylation of the checkpoint kinases Chk1 and Chk2. The possible role of oxidative stress in MitoQ activity was investigated by measuring the products of hydroethidine oxidation. Increases in ethidium and dihydroethidium levels, markers of one-electron oxidation of hydroethidine, were observed at cytotoxic concentrations of MitoQ. Keap1, an oxidative stress sensor protein that regulates the antioxidant transcription factor Nrf2, underwent oxidation, degradation, and dissociation from Nrf2 in MitoQ-treated cells. Nrf2 protein levels, nuclear localization, and transcriptional activity also increased following MitoQ treatment. Knockdown of Nrf2 caused a 2-fold increase in autophagy and an increase in G(1) cell cycle arrest in response to MitoQ but had no apparent effect on apoptosis. The Nrf2-regulated enzyme NQO1 is partly responsible for controlling the level of autophagy. Keap1 and Nrf2 act as redox sensors for oxidative perturbations that lead to autophagy. MitoQ and similar compounds should be further evaluated for novel anticancer activity.


Figures

FIGURE 1.
FIGURE 1.
Growth inhibition and cell cycle arrest by MitoQ or CoQ10. A and B, an SRB dye-based assay was used for measuring cell viability following increasing concentrations of either MitoQ (left) or CoQ10 (right) after 72 h. Breast cancer cell lines (MDA-MB-231 or MCF-7) or healthy breast epithelial cells (MCF-12A) were treated as indicated. B, a colony formation assay was performed on MDA-MB-231 cells incubated with MitoQ. Cells were incubated with MitoQ for 6 h, followed by replacement of medium and replating for a colony formation period of 7 days. C, MDA-MB-231 cells were treated with either MitoQ or CoQ10, as indicated, for 48 h. The cells were fixed and stained with PI followed by flow cytometric analysis. The percentage of cells in each cell cycle phase was quantitated and is provided in each panel. D, the phosphorylation of Chk1 and Chk2 kinases was assayed using confocal microscopy. Representative images of increased nuclear foci corresponding to phospho-Chk1-Ser317 (pChk1-S317), phospho-Chk2-Thr68 (pChk1-T68), and cytoplasmic phospho-Chk1-Ser345 (pChk1-S345) after 0.1 μm MitoQ or 0.1 μm doxorubicin (Dox) treatment (24 h) are shown. Error bars, S.D.
FIGURE 2.
FIGURE 2.
Induction of apoptosis by MitoQ. A, apoptosis was measured by staining with annexin V-PI after a time course of exposure to 1 μm MitoQ from 6 to 72 h. B, cells were also tested after pretreatment for 30 min with the pan-caspase inhibitor benzyloxycarbonyl-VAD-fluoromethyl ketone (z-VAD-fmk) prior to MitoQ (48 h, middle). Treatment with recombinant human TRAIL (rhTRAIL; 10 ng/ml) was used as a positive control for caspase-dependent apoptosis (bottom). C, apoptosis was measured in caspase-3-deficient MCF7 cells after 48 h of MitoQ. D, loss of mitochondrial membrane potential was measured by conversion of the monomeric JC-1 dye (fluorescence emission peak at 590 nm) to its aggregated form (fluorescence emission peak at 540 nm). Co-Q10 and VP-16 (10 μm) were included as controls. The JC-1 emission spectra were taken on cells untreated or treated with MitoQ or VP-16 after 1 h. Representative examples of emission spectra are shown. E, release of cytochrome c into the cytosol was measured by Western blot analysis of cytosolic cell fractions following 1 μm MitoQ treatment and using VP-16 treatment for 24 h as a positive control. The numbers below the bands shows the densitometric quantitation of cytochrome c protein levels normalized to α-tubulin levels from a representative analysis. RFU, relative fluorescence units; Error bars, S.D.
FIGURE 3.
FIGURE 3.
Induction of autophagy by MitoQ in MDA-MB-231 cells. A, transmission electron microscopy was used to study the formation of autophagic vacuoles after 48 h of treatment with 1 μm MitoQ. Representative images are shown from untreated and MitoQ-treated cells with autophagosomes, including one with an engulfed mitochondrion (mitophagy). The mitochondria are marked by white arrowheads. Scale bar, 1 μm. The two smaller images from MitoQ-treated cells show a double-membrane autophagic vacuole (labeled DM) and a fused late stage autophagosome with degraded cellular contents (labeled L). B, the increased levels of the autophagosome-associated LC3-II subunit were used as confirmation of autophagy. MitoQ (1 μm) was tested at 24 and 72 h. Rapamycin was used as a positive control. Increase in LC3-II was confirmed to be from autophagic flux using lysosomal protease inhibitors pepstatin A (10 μg/ml) and E64d (10 μg/ml) in the presence or absence of MitoQ (right). The graphs below show the densitometric quantitation of LC3-II protein levels normalized to α-tubulin levels from a representative analysis. C, measurement of apoptosis following inhibition of autophagy by bafilomycin A using annexin V-PI staining and flow cytometry. MDA-MB-231 cells were treated with MitoQ in the presence or absence of 5 nm bafilomycin A (2-h pretreatment). D, the percentage of cells with autophagosomes (Autophagic) was counted in MitoQ- or rapamycin-treated cells. Error bars, S.D.
FIGURE 4.
FIGURE 4.
Oxidation of Keap1 and its dissociation from Nrf2 in response to MitoQ. A, the generation of ROS by MitoQ was assayed by measuring HE and its oxidation products by HPLC with electrochemical detection in cells treated with HE (10 μm) for the final 30 min of the MitoQ exposure. HPLC with electrochemical detection peak areas of HE, 2-OH-E+, E+, and E+-E+ extracted from MDA-MB-231 cells are shown after normalization to the protein concentration in the cell lysates. Each panel includes the structure of the analyzed compound. B, Keap1 protein oxidation was confirmed by the appearance of a higher molecular weight Keap1 band that only appears under non-reducing conditions (without β-mercaptoethanol). tBHQ (50 μm) was used as a positive control. Keap1 (68 kDa) and modified Keap1 (>120 kDa) are indicated with arrows. Quantitation of the bands representative of the oxidized and total Keap1 proteins is shown after normalization to α-tubulin levels. C, degradation of Keap1 in response to MitoQ was analyzed by Western blotting after exposure to 3, 6, or 24 h with 1 μm MitoQ. tBHQ (at 50 μm) was used as a positive control. D, interaction between Keap1 and Nrf2 is disrupted after MitoQ treatment. Top, Keap1 was immunoprecipitated (IP) from MitoQ- or tBHQ-treated lysates, followed by Western blotting (WB) with anti-Nrf2 antibody. Bottom, Nrf2 was immunoprecipitated from Mito-Q or tBHQ-treated lysates, followed by Western blotting with anti-Keap1 antibody. Input control samples were precleared with agarose beads and were not immunoprecipitated prior to Western blotting. Error bars, S.D.
FIGURE 5.
FIGURE 5.
Increased nuclear protein levels and transcriptional activity of the antioxidant Nrf2. A, nuclear and whole cell fractions of MitoQ-treated MDA-MB-231 cells were probed by Western blotting with anti-Nrf2 antibody. Nucleophosmin (NPM) and α-tubulin (α-tub) levels were used as loading controls for nuclear and whole cell extracts, respectively. B, nuclear translocation of Nrf2 following exposure to MitoQ in MDA-MB-231 cells was examined by confocal microscopy. Nrf2 (green) was probed using anti-Nrf2 antibody, and DAPI staining (blue) was used to localize the nucleus. Inset, single representative cell. A line scan analysis of the confocal images was performed to determine localization of Nrf2 with respect to the nucleus. White color indicates overlapping staining by DAPI and anti-Nrf2 antibody. C, the transcriptional activity of Nrf2 was measured with an assay with immobilized oligonucleotide containing the ARE consensus binding site. tBHQ was used as a positive control. Error bars, S.D.
FIGURE 6.
FIGURE 6.
Knockdown of Nrf2 increases autophagy and cell cycle arrest but not apoptosis by MitoQ. A, conditions for Nrf2 knockdown with siRNA were optimized in MDA-MB-231 cells. Increasing concentrations (at 72 h) and incubation times (with 100 nm) siRNA oligonucleotides were tested. The bands were quantitated using densitometric scanning and normalized to α-tubulin. The relative levels of Nrf2 are indicated below the images. Data shown is representative of three independent experiments. B, increased levels of the autophagosome-associated LC3-II subunit were used as a measure of autophagy 24 h after siRNA. MitoQ (1 μm) was tested at 24 and 72 h. Non-coding siRNA oligonucleotides were used as control siRNA. Data from two individual experiments (Expt.) are shown. C, percentage of cells with autophagosomes after Nrf2 or control siRNA transfection followed by MitoQ treatment were counted as in Fig. 3D. *, statistical significance compared with control siRNA cells. D, cell cycle profiles of Nrf2 or control siRNA cells exposed to MitoQ were analyzed by flow cytometry following staining with PI. The percentage of cells in each cell cycle phase was quantified and is provided in each panel. Right, apoptosis was measured in live Nrf2 siRNA MDA-MB-231 cells treated with 1 μm MitoQ for 72 h. The percentage of cells that were annexin V-positive was used as a measure of apoptosis. Error bars, S.D.
FIGURE 7.
FIGURE 7.
NQO1 plays an essential role in regulating autophagy and cell cycle arrest but not apoptosis after MitoQ treatment. Isogenic MDA-MB-231 cells that were deficient for NQO1 (due to 609C>T polymorphism in NQO1) or with restored expression for NQO1 (using a CMV-driven NQO1 cDNA) were used. A, MDA-MB-231-NQO1-negative cells (with pCDNA3 vector alone, left lane) showed no detectable NQO1 protein in contrast to the MDA-MB-231-NQO1-positive cells (inset). The MDA-MB-231-NQO1-negative cells showed greater reduction in growth than the MDA-MB-231-NQO1-positive cells when exposed to increasing concentrations of MitoQ at 72 h. B, the cell cycle profiles of MDA-MB-231-NQO1-negative cells or MDA-MB-231-NQO1-positive cells exposed to 1 μm MitoQ for 48 h were analyzed by flow cytometry following staining with PI. The percentage of cells in each cell cycle phase was quantified and is provided in each panel. C, apoptosis was measured in live cells after staining with annexin V and propidium iodide following MitoQ treatment at 48 h. The percentage of cells that were annexin V-positive was used as a measure of apoptosis. D, autophagosome-associated LC3-II protein was measured as an indicator of autophagy after 24 h exposure to MitoQ in the MDA-MB-231-NQO1-negative and MDA-MB-231-NQO1-positive cells. E, the NQO1 inhibitor, dicumarol, was used in MDA-MB-231 cells to confirm results from the isogenic cell lines (50 μm, 1-h pretreatment). F, percentage of cells with autophagosomes in the isogenic cell lines followed by MitoQ treatment were counted as in Fig. 3D. *, statistical significance compared with control siRNA cells. G, schematic model for the proposed mechanism for the anticancer cytotoxicity induced by MitoQ (see “Discussion”). Error bars, S.D.

References

    1. Murphy M. P. (1997) Trends Biotechnol. 15, 326–330 - PubMed
    1. Murphy M. P. (2008) Biochim. Biophys. Acta 1777, 1028–1031 - PubMed
    1. Kalivendi S. V., Konorev E. A., Cunningham S., Vanamala S. K., Kaji E. H., Joseph J., Kalyanaraman B. (2005) Biochem. J. 389, 527–539 - PMC - PubMed
    1. Kelso G. F., Porteous C. M., Coulter C. V., Hughes G., Porteous W. K., Ledgerwood E. C., Smith R. A., Murphy M. P. (2001) J. Biol. Chem. 276, 4588–4596 - PubMed
    1. Koopman W. J., Verkaart S., Visch H. J., van der Westhuizen F. H., Murphy M. P., van den Heuvel L. W., Smeitink J. A., Willems P. H. (2005) Am. J. Physiol. Cell Physiol. 288, C1440–C1450 - PubMed

Publication types

MeSH terms