. 2010 Oct;38(6):872-906.
doi: 10.1177/0192623310374329. Epub 2010 Aug 30.

Histology atlas of the developing mouse hepatobiliary system with emphasis on embryonic days 9.5-18.5

Affiliations

Histology atlas of the developing mouse hepatobiliary system with emphasis on embryonic days 9.5-18.5

Laura Wilding Crawford et al. Toxicol Pathol. 2010 Oct.

Abstract

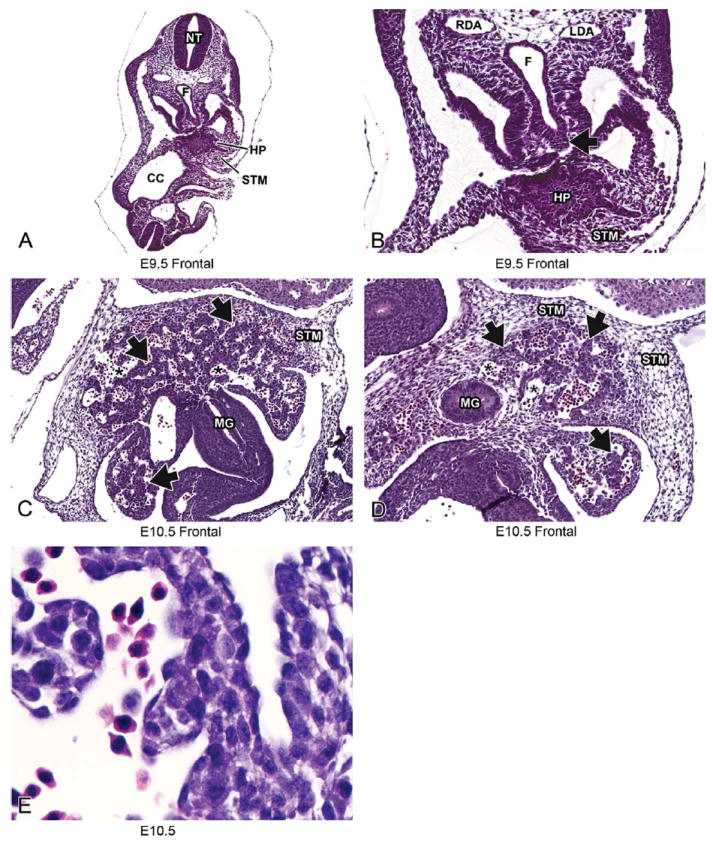
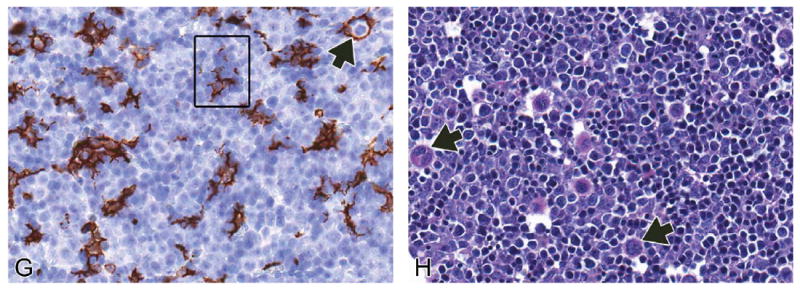
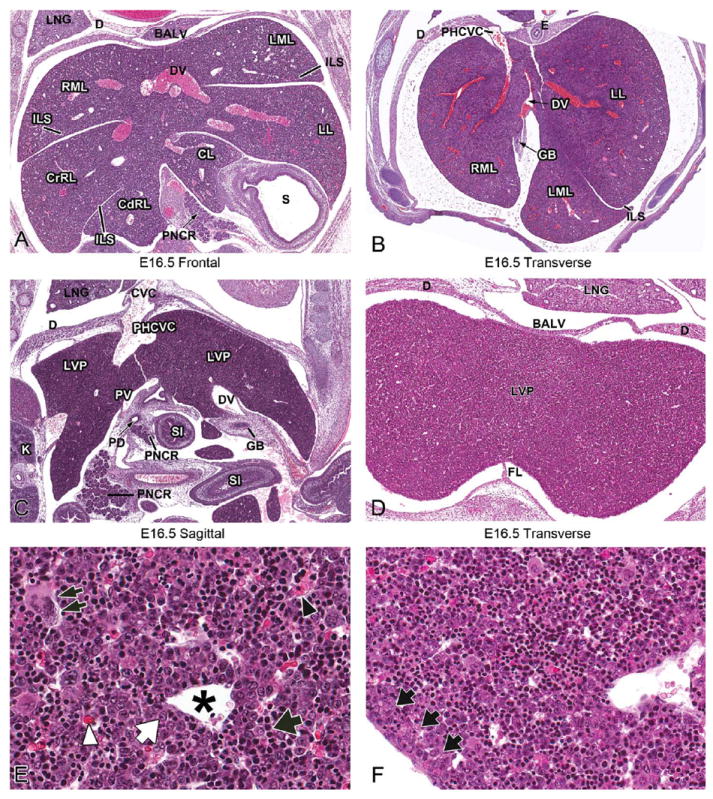
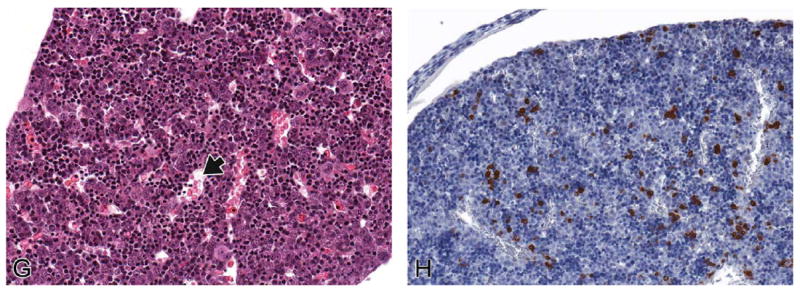
Animal model phenotyping, in utero exposure toxicity studies, and investigation into causes of embryonic, fetal, or perinatal deaths have required pathologists to recognize and diagnose developmental disorders in spontaneous and engineered mouse models of disease. In mammals, the liver is the main site of hematopoiesis during fetal development, has endocrine and exocrine functions important for maintaining homeostasis in fetal and adult life; and performs other functions including waste detoxification, production and removal of glucose, glycogen storage, triglyceride and fatty acid processing, and serum protein production. Due to its role in many critical functions, alterations in the size, morphology, or function(s) of the liver often lead to embryonic lethality. Many publications and websites describe individual aspects of hepatobiliary development at defined stages. However, no single resource provides a detailed histological evaluation of H&E-stained sections of the developing murine liver and biliary systems using high-magnification and high-resolution color images. The work herein provides a histology atlas of hepatobiliary development between embryonic days 9.5-18.5. Although the focus of this work is normal hepatobiliary development, common defects in liver development are also described as a reference for pathologists who may be asked to phenotype mice with congenital, inherited, or treatment-related hepatobiliary defects. Authors' note: All digital images can be viewed online at https://niehsimagesepl-inc.com with the username "ToxPathLiver" and the password "embryolivers."


Figures

FIGURE 1
FIGURE 1
Cell lineage allocation during hepatobiliary development. Schematic representation of the steps involved in endoderm specification to gallbladder and hepatic fates. The liver bud is derived from the caudal foregut endoderm. The liver bud is composed of a cranial and caudal lobe (though these are not distinguishable histologically). The cranial lobe gives rise to hepatoblasts, which subsequently differentiate into either hepatocytes or biliary epithelial cells. Biliary epithelial cells can become part of either the extra- or intrahepatic biliary systems. The caudal lobe gives rise to the gallbladder as well as to some biliary epithelial cells.
FIGURE 2
FIGURE 2
Development of venous drainage within the liver. Prior to development of the septum transversum and liver, the vitelline veins drain the primitive gut. The umbilical veins carry oxygenated blood from the placenta and run on the lateral sides of the vitelline veins (A). Later in development, the liver bud can be seen developing at the foregut-midgut junction (B). As the liver grows, changes to the vascular system occur. The vitelline veins enter and ramify within the septum transversum, forming the hepatic sinusoids. The two umbilical veins give rise to both an intra- and extrahepatic branch (C). The extrahepatic branches of the umbilical vein regress, along with extrahepatic portion of the left vitelline vein (D). The right intra-hepatic vitelline vein becomes the portal vein, which aids in venous drainage of the gut. The umbilical vein from the left side forms a wide channel known as the ductus venosus, which allows oxygenated blood from the placenta to bypass the liver and move directly into the right atrium through a posthepatic portion of the developing caudal vena cava (E). Adapted with permission from Kaufman and Bard (, 148, Figure 4.4.9), copyright Elsevier (1999); and from Langman and Sandler (, 248, Figures 11.41 and 11.42), copyright Lippincott Williams & Wilkins (2006). CCV = common cardinal vein; DUOD = duodenum; DV = ductus venosus; LUV = left umbilical vein; LVV = left vitelline vein; PHCVC = posthepatic caudal vena cava; PV = portal vein; REHB = right extrahepatic branch; RIHB = right intrahepatic branch; RUV = right umbilical vein; RVV = right vitelline vein; STM = septum transversum mesenchyme; SV = sinus venosus.
FIGURE 3
FIGURE 3
Representative images of E9.5 and E10.5 embryonic mouse liver. Low-magnification H&E-stained frontal sections at E9.5 (A, B) and E10.5 (C, D). High magnification at E10.5 (E). Histologically, liver development begins around E9.5 as a diverticulum of proliferating endodermal cells arising from the ventral surface of the caudal foregut (A, B, arrow). By E10.5 (C, D), the epithelial sheets of the liver bud have undergone elongation and branching to form hepatic cords (arrows) separated by blood-filled sinusoids (asterisks). The hepatic cords delaminate from the foregut and move into the septum transversum mesenchyme at this stage. At high magnification, clear vacuoles can be seen within the hepatoblast cytoplasm and nucleated red blood cells can be seen within the sinusoids (E). CC = coelomic cavity; F = foregut; HP= hepatic primordium; LDA = left dorsal aorta; MG = midgut; NT = neural tube; RDA = right dorsal aorta; STM = septum transversum mesenchyme.
FIGURE 4
FIGURE 4
Representative images of the E11.5 embryonic mouse liver. H&E-stained frontal (A), transverse (B), and sagittal (C) sections of liver at low magnification. High-magnification H&E (D, E) and F4/80 IHC (F) sections. The size of the liver has expanded to occupy a substantial portion of the cranial half of the abdominal cavity (A, B). This expansion is due to the rapid proliferation of hepatoblasts and hematopoietic activity (C). High magnification illustrates that the liver is mostly composed of hepatic cords (D, arrows) and sinusoids (D, asterisk) at this stage in development. The hepatic cords are composed of primarily largely undifferentiated hepatoblasts (E, white arrow). Significant expansion in size and the onset of hematopoietic activity account for the high mitotic index in the liver at this stage (E, double arrows). All RBCs found within the vessels are nucleated (E, arrowhead). Endothelial cells can be seen lining vascular spaces (E, black arrows). Macrophages can be easily identified by IHC using the antibody F4/80 (F). AO = aorta; DUOD = duodenum; DV = ductus venosus; HRT = heart; LVP = liver parenchyma; PHCVC = post-hepatic caudal vena cava; STM = septum transversum mesenchyme.
FIGURE 5
FIGURE 5
Representative images of the E12.5 embryonic mouse liver. H&E-stained frontal (A) and transverse (B, C, D) sections of liver at low magnification. High-magnification H&E (E) and Pax5 IHC (F) sections. The density of the liver has increased and division of the liver into lobes via fissures has begun, forming interlobular spaces (A–D). The venous sinusoids appear less numerous due to the increase in functional hepatic parenchyma (A, asterisk). Hematopoietic activity has increased and erythroblasts (E, black arrow) now dominate the field. The majority of the hematopoietic cell population at this developmental stage is of the erythroid lineage and can be identified by the intense, hyperchromatic nuclei. In contrast, hepatoblasts have a larger, pale staining nucleus, with 2-3 distinct nucleoli (E, white arrow). RBCs found within the vessels are still all nucleated at this stage (E, arrowhead). B-cell progenitors are scarce as identified by the Pax5 antibody (F, arrow). AO = aorta; CBD = common bile duct; CdRL = caudal right lobe of liver; CrRL = cranial right lobe of liver; D = diaphragm; DUOD = duodenum; DV = ductus venosus; E = esophagus; HRT = heart; ILS = interlobar space; LL = left lobe; LNG = lung; LVP = liver parenchyma; PHCVC = posthepatic caudal vena cava; PNCR = pancreas; PV = portal vein; S = stomach; SI = small intestine.
FIGURE 6
FIGURE 6
Representative images of the E13.5 embryonic mouse liver. H&E-stained frontal (A), transverse (B, C), and sagittal (D) sections of liver at low magnification. High-magnification H&E (E, F), F4/80 IHC (G) and PAS (H) sections. At E13.5, the liver achieves its final embryonic architecture, although it will continue to grow in size throughout the remainder of development (A–D). The falciform ligament can be seen on transverse section through the most cranial portion of the liver beginning at E13.5 and throughout the remainder of development (C). After this stage, changes seen in the developing liver occur primarily at the cellular level. This stage represents the peak in hematopoietic activity in the liver. At high magnification, the field is dominated by hematopoietic cells (E, arrowhead). Hepatoblasts (E, white arrow) have little contact with each other. The density of hepatoblasts is relatively higher at the periphery of the liver than in the core (F, arrows). Megakaryocytes (E, black arrows) are found in high numbers at this stage of development. Erythroblastic islands are found throughout the liver (F, G, squares). The anatomic unit of an island consists of a central F4/80-positive macrophage surrounded by one or more concentric rings of maturing erythroblasts (G, arrow). PAS stain assists in the identification of megakaryocytes (H, arrows). CD = cystic duct; CdRL = caudal right lobe of liver; CL = caudate lobe of liver; CrRL = cranial right lobe of liver; D = diaphragm; DV = ductus venosus; E = esophagus; FL = falciform ligament; GB = gallbladder; HRT = heart; ILS = interlobar space; K = kidney; LL = left lobe; LML = left medial lobe; LNG = lung; LVP = liver parenchyma; PHCVC = posthepatic caudal vena cava; PNCR = pancreas; PV = portal vein; RML = right medial lobe; S = stomach.
FIGURE 6
FIGURE 6
Representative images of the E13.5 embryonic mouse liver. H&E-stained frontal (A), transverse (B, C), and sagittal (D) sections of liver at low magnification. High-magnification H&E (E, F), F4/80 IHC (G) and PAS (H) sections. At E13.5, the liver achieves its final embryonic architecture, although it will continue to grow in size throughout the remainder of development (A–D). The falciform ligament can be seen on transverse section through the most cranial portion of the liver beginning at E13.5 and throughout the remainder of development (C). After this stage, changes seen in the developing liver occur primarily at the cellular level. This stage represents the peak in hematopoietic activity in the liver. At high magnification, the field is dominated by hematopoietic cells (E, arrowhead). Hepatoblasts (E, white arrow) have little contact with each other. The density of hepatoblasts is relatively higher at the periphery of the liver than in the core (F, arrows). Megakaryocytes (E, black arrows) are found in high numbers at this stage of development. Erythroblastic islands are found throughout the liver (F, G, squares). The anatomic unit of an island consists of a central F4/80-positive macrophage surrounded by one or more concentric rings of maturing erythroblasts (G, arrow). PAS stain assists in the identification of megakaryocytes (H, arrows). CD = cystic duct; CdRL = caudal right lobe of liver; CL = caudate lobe of liver; CrRL = cranial right lobe of liver; D = diaphragm; DV = ductus venosus; E = esophagus; FL = falciform ligament; GB = gallbladder; HRT = heart; ILS = interlobar space; K = kidney; LL = left lobe; LML = left medial lobe; LNG = lung; LVP = liver parenchyma; PHCVC = posthepatic caudal vena cava; PNCR = pancreas; PV = portal vein; RML = right medial lobe; S = stomach.
FIGURE 7
FIGURE 7
Representative images of the E14.5 embryonic mouse liver. H&E-stained frontal (A), transverse (B), and sagittal (C) sections of liver at low magnification. High-magnification H&E (D), F4/80 IHC (E) and Pax5 IHC (F) sections. Low-magnification images of the liver at E14.5 reveal a similar architecture to that seen at E13.5 (A–C). Most of the RBCs present within vessels of the liver at E14.5 are still nucleated (D, arrowhead). Many of the hematopoietic foci at this developmental time point appear cord-shaped (D, double arrows). At this stage, hepatoblasts give rise to mature hepatocytes (D, white arrow); however, this change is not observed with H&E staining and would require stage-specific molecular markers to characterize. The erythroblastic islands observed at E13.5 are still present at E14.5, but their numbers are increased and can be evaluated with an F4/80 stain (E; compare panel A to B). IHC staining using the Pax5 antibody identifies a low number of B-cells scattered throughout the liver (F, arrow). CBD = common bile duct; CdRL = caudal right lobe of liver; D = diaphragm; DV = ductus venosus; E = esophagus; HRT = heart; IHCVC = intrahepatic caudal vena cava; ILS = interlobar space; K = kidney; LL = left lobe; LML = left medial lobe; LNG = lung; LVP = liver parenchyma; Ov = ovary; PHCVC = posthepatic caudal vena cava; PNCR = pancreas; PrHCVC = prehepatic caudal vena cava; PV = portal vein; RML = right medial lobe; S = stomach; SI = small intestine.
FIGURE 8
FIGURE 8
Representative images of the E15.5 fetal mouse liver. H&E-stained frontal (A), transverse (B, C), and sagittal (D) sections of liver at low magnification. High-magnification H&E (E, F) sections. At low magnification, the liver is structurally similar to the two previous days (A–D). Hematopoiesis within the liver begins to decline at this stage. Many of the nucleated red blood cells (E, arrowhead) once present have now extruded their nuclei (E, asterisk), and erythrocyte size is highly variable (F). Megakaryocytes are still seen in high numbers at this stage (E, double arrows). BALV = bare area of the liver; CBD = common bile duct; CdRL = caudal right lobe of liver; CL = caudate lobe of liver; CrRL = cranial right lobe of liver; D = diaphragm; DV = ductus venosus; E = esophagus; FL = falciform ligament; GB = gallbladder; HRT = heart; K = kidney; LL = left lobe; LML = left medial lobe; LNG = lung; LVP = liver parenchyma; PHCVC = prehepatic caudal vena cava; PNCR = pancreas; PV = portal vein; RML = right medial lobe; S = stomach; SI = small intestine; T = testis.
FIGURE 9
FIGURE 9
Representative images of the E16.5 fetal mouse liver. H&E-stained frontal (A) transverse (B, D), and sagittal (C) sections of E16.5 liver at low magnification. High-magnification H&E (E–G) and myeloperoxidase IHC (H) sections. At this stage, low-magnification architecture of the liver does not differ from the previous several days (A–D). Hematopoiesis in the liver continues to decline (E, black arrow), allowing hepatocytes (E, white arrow) to gain increased contact with one another. Megakaryocytes are still seen in relatively high numbers at this stage (E, double arrows). Hepatocytes are beginning to have greater contact with each other, and this is most obvious toward the periphery of the liver (F, arrows). Within vessels, most of the RBCs have extruded their nuclei (G, arrow; E, asterisk, white arrowhead), although occasional nucleated RBCs can be found (E, black arrowhead). IHC staining using the myeloperoxidase antibody demonstrates an increased number of granulocyte progenitors scattered individually or as small foci throughout the liver (H). BALV = bare area of the liver; CdRL = caudal right lobe of liver; CL = caudate lobe of liver; CrRL = cranial right lobe of liver; CVC = caudal vena cava; D = diaphragm; DV = ductus venosus; E = esophagus; FL = falciform ligament; GB = gallbladder; ILS = interlobar space; K = kidney; LL = left lobe; LML = left medial lobe; LNG = lung; LVP = liver parenchyma; PD = pancreatic duct; PHCVC = posthepatic caudal vena cava; PNCR = pancreas; PV = portal vein; RML = right medial lobe; S = stomach; SI = small intestine.
FIGURE 9
FIGURE 9
Representative images of the E16.5 fetal mouse liver. H&E-stained frontal (A) transverse (B, D), and sagittal (C) sections of E16.5 liver at low magnification. High-magnification H&E (E–G) and myeloperoxidase IHC (H) sections. At this stage, low-magnification architecture of the liver does not differ from the previous several days (A–D). Hematopoiesis in the liver continues to decline (E, black arrow), allowing hepatocytes (E, white arrow) to gain increased contact with one another. Megakaryocytes are still seen in relatively high numbers at this stage (E, double arrows). Hepatocytes are beginning to have greater contact with each other, and this is most obvious toward the periphery of the liver (F, arrows). Within vessels, most of the RBCs have extruded their nuclei (G, arrow; E, asterisk, white arrowhead), although occasional nucleated RBCs can be found (E, black arrowhead). IHC staining using the myeloperoxidase antibody demonstrates an increased number of granulocyte progenitors scattered individually or as small foci throughout the liver (H). BALV = bare area of the liver; CdRL = caudal right lobe of liver; CL = caudate lobe of liver; CrRL = cranial right lobe of liver; CVC = caudal vena cava; D = diaphragm; DV = ductus venosus; E = esophagus; FL = falciform ligament; GB = gallbladder; ILS = interlobar space; K = kidney; LL = left lobe; LML = left medial lobe; LNG = lung; LVP = liver parenchyma; PD = pancreatic duct; PHCVC = posthepatic caudal vena cava; PNCR = pancreas; PV = portal vein; RML = right medial lobe; S = stomach; SI = small intestine.
FIGURE 10
FIGURE 10
Representative images of the E17.5 fetal mouse liver. H&E-stained frontal (A) transverse (B, D), and sagittal (C) sections of liver at low magnification. High-magnification H&E (E, G, K), PAS (F), myeloperoxidase IHC (H–J), and Pax5 IHC (L) sections. At this stage of development, the low-magnification view of the fetal liver looks nearly identical to previous stages (A-D). The hepatocytes are beginning to organize and form mature hepatic cords (E, brackets). Hepatocellular cytoplasmic glycogen stores can be seen as clumped intracytoplasmic pink material with PAS staining (F). Hematopoiesis continues to decline, and the liver begins to establish small, solitary hematopoietic foci (E, arrows). Megakaryocytes are present, but in decreased numbers (E, double arrows). The RBCs within vessels in the liver at E17.5 are nearly all anucleate (G). Myeloperoxidase IHC identifies increased clusters of granulocytes dispersed throughout the liver as well as subcapsular (H, arrows) and perivascular (I, J) aggregates. These cells can also be seen with H&E stain (K, arrows). Pax 5 IHC reveals that B lymphocytes are increased in numbers, both scattered throughout the liver (L) and within perivascular hematopoietic aggregates. BALV = bare area of the liver; BD = bile duct; CBD = common bile duct; CrRL = cranial right lobe of liver; D = diaphragm; DA=ductus arteriosus; DUOD=duodenum; DV=ductus venosus; E=esophagus; FL=falciform ligament; GB=gallbladder; HRT=heart; K=kidney;LL=left lobe; LNG=lung; LML=left medial lobe; LVP=liver parenchyma; PHCVC=posthepatic caudal vena cava; PNCR = pancreas; PV = portal vein; RML = right medial lobe; S = stomach; SI = small intestine.
FIGURE 10
FIGURE 10
Representative images of the E17.5 fetal mouse liver. H&E-stained frontal (A) transverse (B, D), and sagittal (C) sections of liver at low magnification. High-magnification H&E (E, G, K), PAS (F), myeloperoxidase IHC (H–J), and Pax5 IHC (L) sections. At this stage of development, the low-magnification view of the fetal liver looks nearly identical to previous stages (A-D). The hepatocytes are beginning to organize and form mature hepatic cords (E, brackets). Hepatocellular cytoplasmic glycogen stores can be seen as clumped intracytoplasmic pink material with PAS staining (F). Hematopoiesis continues to decline, and the liver begins to establish small, solitary hematopoietic foci (E, arrows). Megakaryocytes are present, but in decreased numbers (E, double arrows). The RBCs within vessels in the liver at E17.5 are nearly all anucleate (G). Myeloperoxidase IHC identifies increased clusters of granulocytes dispersed throughout the liver as well as subcapsular (H, arrows) and perivascular (I, J) aggregates. These cells can also be seen with H&E stain (K, arrows). Pax 5 IHC reveals that B lymphocytes are increased in numbers, both scattered throughout the liver (L) and within perivascular hematopoietic aggregates. BALV = bare area of the liver; BD = bile duct; CBD = common bile duct; CrRL = cranial right lobe of liver; D = diaphragm; DA=ductus arteriosus; DUOD=duodenum; DV=ductus venosus; E=esophagus; FL=falciform ligament; GB=gallbladder; HRT=heart; K=kidney;LL=left lobe; LNG=lung; LML=left medial lobe; LVP=liver parenchyma; PHCVC=posthepatic caudal vena cava; PNCR = pancreas; PV = portal vein; RML = right medial lobe; S = stomach; SI = small intestine.
FIGURE 11
FIGURE 11
Representative images of the E18.5 fetal mouse liver. H&E-stained frontal (A), transverse (B, D), and sagittal (C) sections of liver at low magnification. High-magnification H&E (E) and myeloperoxidase IHC (F) sections. The low-magnification liver architecture is nearly identical to what was seen at E17.5 (A–D). The hematopoietic population at this age has been reduced to small, solitary foci. Hepatic cord formation becomes more obvious as hepatocytes gain contact with each other (E, brackets). Myeloperoxidase IHC staining identifies a decreased number of granulocytes within the liver parenchyma (F). Fewer granulocytes aggregate along the subcapsular space and around hepatic vessels but can still be seen lining interlobar subcapsular spaces (F, arrows). BALV = bare area of the liver; CVC = caudal vena cava; CdRL = caudal right lobe of liver; CL = caudate lobe of liver; CrRL = cranial right lobe of liver; D = diaphragm; E = esophagus; FL = falciform ligament; GB = gallbladder; ILS = interlobar space; LL = left lobe; LML = left medial lobe; LNG = lung; LUV = left umbilical vein; LVP = liver parenchyma; PHCVC = posthepatic caudal vena cava; PNCR = pancreas; PV = portal vein; RML = right medial lobe; S = stomach; SI = small intestine.
FIGURE 12
FIGURE 12
Development of the intrahepatic biliary system (A–E). High-magnification H&E section at E17.5 (F) and CK-19 IHC section at E18.5 (G). At E13.5-14.5, biliary precursor cells expressing CK19 are found close to the portal mesenchyme (A). Around E15.5, the biliary precursor cells form a single-layered ring called the ductal plate (B). This ring becomes bilayered close to E16.5 (C). At E17.5, focal dilations appear between the two layers (D). These dilations give rise to the intrahepatic bile duct, and the rest of the ductal plate regresses. Near the time of birth, the ducts become incorporated into the portal mesenchyme (E). At E17.5, the bile ducts that have formed adjacent to central veins can be identified by an H&E stain (F, arrows). CK-19 IHC stain is used to identify the ductal plate and can be used to monitor its development as seen at E18.5 (G, arrows). Adapted with permission from Lemaigre (, 82, Figure 2).
FIGURE 13
FIGURE 13
Development of the extrahepatic biliary system. Schematic illustration of the extrahepatic biliary system (A): bile is produced in hepatocytes in the liver and flows into bile canaliculi, and then into the right and left hepatic ducts. The hepatic ducts come together to form the common hepatic duct, which then joins with the cystic duct from the gallbladder. Together, these form the common bile duct. Bile is stored in the gallbladder and transported from the gallbladder into the duodenum via the common bile duct. Representative H&E-stained sections illustrating the gallbladder, hepatic ducts, cystic duct, and common bile duct leading into the duodenum at various stages of development (B–K). At E11.5, the gallbladder can be seen elongating with the liver and is surrounded by mesenchyme (C). A single layer of pseudostratified epithelium lines the gallbladder although tangential sections may give the appearance of “piling up” (B). It should be noted that the abdominal portion of the esophagus is sometimes situated between liver lobes where it can be mistaken for the gallbladder (D). Following the gallbladder in serial transverse section will eventually reveal the hepatic ducts and cystic duct, which empty into the common bile duct (E–K). The common bile duct can be followed in serial sections as it connects the gallbladder and duodenum (G, H). Figure 13L shows CK-19 positivity in the apical aspect of the cystic duct epithelium (arrow). CBD = common bile duct; CD = cystic duct; CdRL = caudal right lobe of liver; CrRL = cranial right lobe of liver; D = diaphragm; DUOD = duodenum; DV = ductus venosus; E = esophagus; GB = gallbladder; HD= hepatic duct; ILS= interlobar space;K = kidney; LHD= left hepatic duct; LL= left lobe;LML= left medial lobe; LNG= lung; LVP= liver parenchyma;MES=mesenchyme;PHCVC=post hepatic caudal vena cava; PNCR=pancreas;RHD=right hepatic duct;RML=rightmedial lobe; S = stomach; SI = small intestine; STM = septum transversum mesenchyme.
FIGURE 13
FIGURE 13
Development of the extrahepatic biliary system. Schematic illustration of the extrahepatic biliary system (A): bile is produced in hepatocytes in the liver and flows into bile canaliculi, and then into the right and left hepatic ducts. The hepatic ducts come together to form the common hepatic duct, which then joins with the cystic duct from the gallbladder. Together, these form the common bile duct. Bile is stored in the gallbladder and transported from the gallbladder into the duodenum via the common bile duct. Representative H&E-stained sections illustrating the gallbladder, hepatic ducts, cystic duct, and common bile duct leading into the duodenum at various stages of development (B–K). At E11.5, the gallbladder can be seen elongating with the liver and is surrounded by mesenchyme (C). A single layer of pseudostratified epithelium lines the gallbladder although tangential sections may give the appearance of “piling up” (B). It should be noted that the abdominal portion of the esophagus is sometimes situated between liver lobes where it can be mistaken for the gallbladder (D). Following the gallbladder in serial transverse section will eventually reveal the hepatic ducts and cystic duct, which empty into the common bile duct (E–K). The common bile duct can be followed in serial sections as it connects the gallbladder and duodenum (G, H). Figure 13L shows CK-19 positivity in the apical aspect of the cystic duct epithelium (arrow). CBD = common bile duct; CD = cystic duct; CdRL = caudal right lobe of liver; CrRL = cranial right lobe of liver; D = diaphragm; DUOD = duodenum; DV = ductus venosus; E = esophagus; GB = gallbladder; HD= hepatic duct; ILS= interlobar space;K = kidney; LHD= left hepatic duct; LL= left lobe;LML= left medial lobe; LNG= lung; LVP= liver parenchyma;MES=mesenchyme;PHCVC=post hepatic caudal vena cava; PNCR=pancreas;RHD=right hepatic duct;RML=rightmedial lobe; S = stomach; SI = small intestine; STM = septum transversum mesenchyme.

Similar articles

Cited by

References

    1. Ananthanarayanan V, Pins MR, Meyer RE, Gann PH. Immunohistochemical assays in prostatic biopsies processed in Bouin’s fixative. J Clin Pathol. 2005;58:322–4. - PMC - PubMed
    1. Apte U, Zeng G, Thompson MD, Muller P, Micsenyi A, Cieply B, Kaestner KH, Monga SP. Beta-Catenin is critical for early postnatal liver growth. Am J Physiol Gastrointest Liver Physiol. 2007;292:G1578–85. - PubMed
    1. Asano H, Kobayashi M, Hoshino T. The hemopoietic microenvironment in the fetal liver of mice: relationship between developing hepatocytes and erythroblasts. J Electron Microsc (Tokyo) 1987;36:15–25. - PubMed
    1. Behrens A, Sibilia M, David JP, Mohle-Steinlein U, Tronche F, Schutz G, Wagner EF. Impaired postnatal hepatocyte proliferation and liver regeneration in mice lacking c-jun in the liver. EMBO J. 2002;21:1782–90. - PMC - PubMed
    1. Chasis JA. Erythroblastic islands: Specialized microenvironmental niches for erythropoiesis. Curr Opin Hematol. 2006;13:137–41. - PubMed