. 2010 Sep 6;190(5):893-910.
doi: 10.1083/jcb.201004102. Epub 2010 Aug 30.

A testis-specific regulator of complex and hybrid N-glycan synthesis

Affiliations

A testis-specific regulator of complex and hybrid N-glycan synthesis

Hung-Hsiang Huang et al. J Cell Biol. .

Abstract

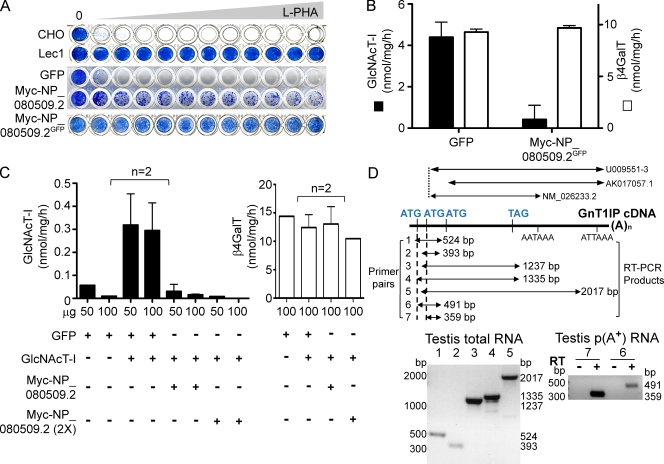
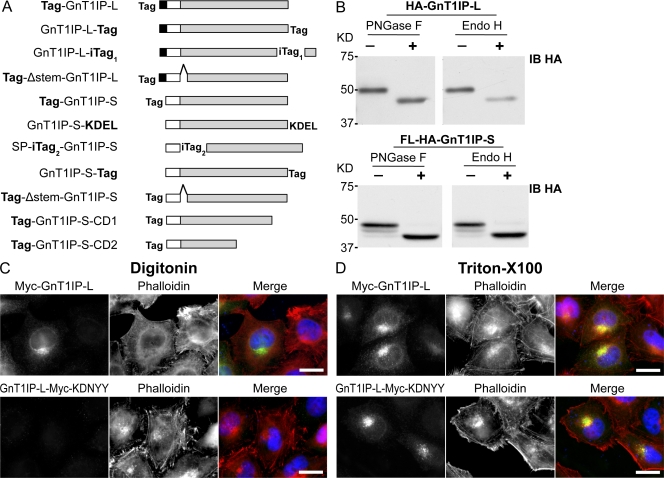
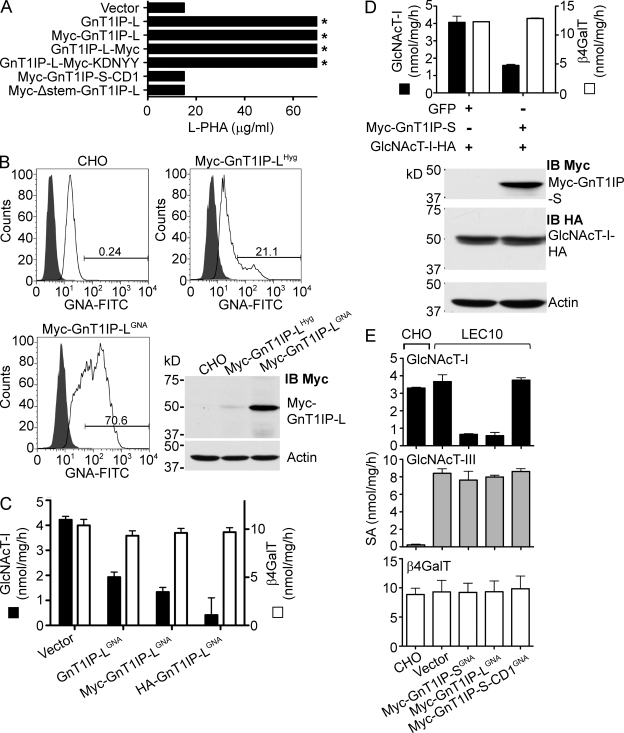
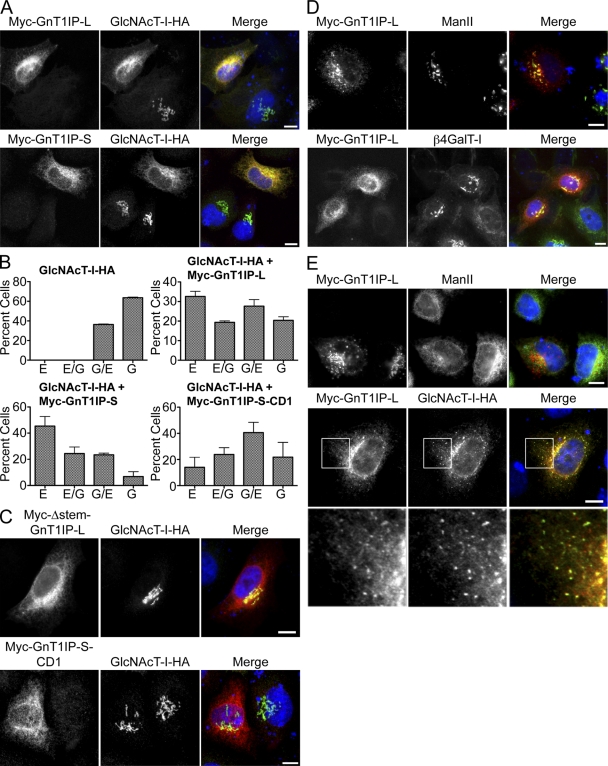
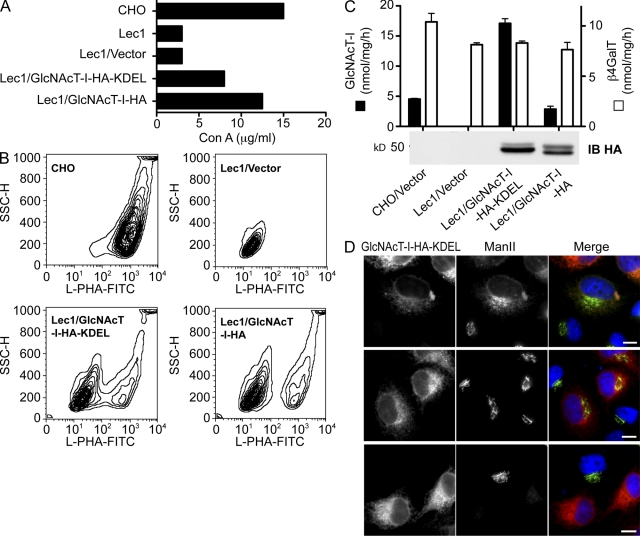
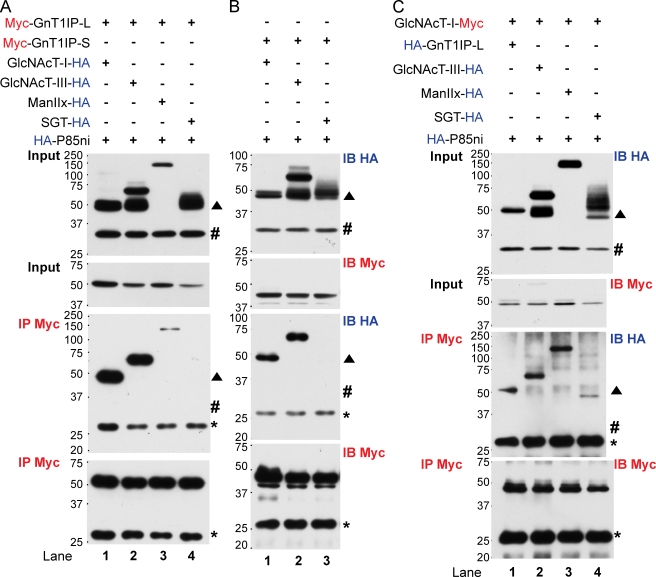
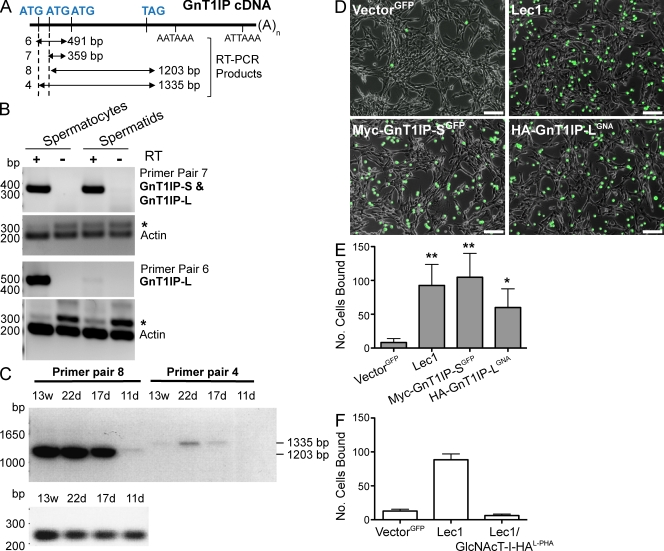
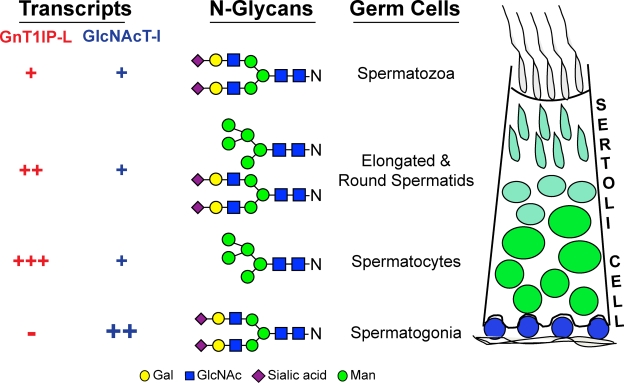
Database analyses identified 4933434I20Rik as a glycosyltransferase-like gene expressed mainly in testicular germ cells and regulated during spermatogenesis. Expression of a membrane-bound form of the protein resulted in a marked and specific reduction in N-acetylglucosaminyltransferase I (GlcNAcT-I) activity and complex and hybrid N-glycan synthesis. Thus, the novel activity was termed GlcNAcT-I inhibitory protein (GnT1IP). Membrane-bound GnT1IP localizes to the ER, the ER-Golgi intermediate compartment (ERGIC), and the cis-Golgi. Coexpression of membrane-anchored GnT1IP with GlcNAcT-I causes association of the two proteins, inactivation of GlcNAcT-I, and mislocalization of GlcNAcT-I from the medial-Golgi to earlier compartments. Therefore, GnT1IP is a regulator of GlcNAcT-I and complex and hybrid N-glycan production. Importantly, the formation of high mannose N-glycans resulting from inhibition of GlcNAcT-I by GnT1IP markedly increases the adhesion of CHO cells to TM4 Sertoli cells. Testicular germ cells might use GnT1IP to induce the expression of high mannose N-glycans on glycoproteins, thereby facilitating Sertoli-germ cell attachment at a particular stage of spermatogenesis.


Figures

Figure 1.
Figure 1.
Expression of NP_080509.2 in CHO cells inhibits GlcNAcT-I. (A) L-PHA resistance of CHO, Lec1 cells, or CHO cells stably expressing GFP or Myc-NP_080509.2 or Myc-NP_080509.2GFP sorted for GFP. Cells were stained with Methylene Blue when control wells with no L-PHA became confluent. The highest L-PHA concentration was 70 µg/ml. (B) GlcNAcT-I and β4GalT activities in lysates from CHO cells stably expressing Myc-NP_080509.2GFP. Error bars = SD; n = 3. (C) GlcNAcT-I and β4GalT activities in lysates of Lec1 cells transiently expressing GFP, GFP and GlcNAcT-I, or Myc-NP_080509.2 and GlcNAcT-I. Myc-NP_080509.2 (2x) received 2x cDNA. Bars represent range (n = 2). (D) Diagram of mouse cDNAs NM_026233.2, AK017057.1, and U009551-3, and the predicted products of RT-PCR. Primer pairs 1, 4, 6 detect only GnT1IP-L; pairs 2, 3, 5, 7 detect both GnT1IP-L and -S. Left panel, RT-PCR of adult testis total RNA with primer pairs 1–5. Right panel, RT-PCR of testis poly(A+) RNA with primer pairs 6 and 7.
Figure 2.
Figure 2.
GnT1IP-L is a type II transmembrane glycoprotein with high mannose N-glycans. (A) GnT1IP constructs showing the N-terminal cytosolic domain of GnT1IP-L (aa 1–48; black box); the predicted transmembrane domain of GnT1IP-L (aa 49–69; white box) or signal peptide (SP) of GnT1IP-S (aa 1–26); the Golgi lumenal domain (aa 70–417 for GnT1IP-L and aa 27–373 for GnT1IP-S; gray box), and the C-terminal deletion mutants Tag-GnT1IP-S-CD1 (39 aa deletion) and -CD2 (122 aa deletion); Tag represents FLAG-HA (FL-HA), HA, or Myc; internal tags were inserted after aa 412 of GnT1IP-L (iTag1) and after aa 26 of GnT1IP-S (iTag2); the 48 aa stem-region deletion (Δ stem) from aa 71–118 in GnT1IP-L and aa 27–74 in GnT1IP-S is shown by a hat. The KDEL sequence was inserted after aa 373 of GnT1IP-S. (B) Lysates from CHO cells expressing HA-GnT1IP-L or FL-HA-GnT1IP-S digested with PNGase F or Endo H (+) or incubated without enzyme (−) and subjected to immunoblotting using anti-HA mAb (IB HA). (C) HeLa cells transiently expressing Myc-GnT1IP-L or GnT1IP-L-Myc-KDNYY were fixed, treated with 5 µg/ml digitonin or (D) 0.2% Triton X-100, immunolabeled for Myc-tagged GnT1IP-L (green) and actin (phalloidin; red), and observed by fluorescence microscopy. Bars, 20 µm.
Figure 3.
Figure 3.
GnTIP-L inhibition of GlcNAcT-I is specific and deletion mutants do not inhibit. (A) CHO cells stably expressing various GnT1IP-L constructs were tested for L-PHA resistance. Asterisk signifies that ∼50% cells survived at 70 µg/ml L-PHA. (B) CHO cells stably expressing Myc-GnT1IP-L after hygromycin selection (Myc-GnT1IP-LHyg) were sorted for GNA binding (Myc-GnT1IP-LGNA) and analyzed by flow cytometry. Shaded profiles are autofluorescence. Lysates were analyzed by immunoblot (IB Myc), stripped and reprobed with anti-actin mAb. (C) GlcNAcT-I and β4GalT activities in lysates from CHO cells stably expressing vector or GNA-sorted GnT1IP-LGNA or Myc-GnT1IP-LGNA or HA-GnT1IP-LGNA (GNA-sorted twice). Bars represent range (n = 2). (D) Lysates from Lec1 cells stably expressing GlcNAcT-I-HA and transiently expressing GFP or Myc-GnT1IP-S were assayed for GlcNAcT-I and β4GalT activities. Bars represent range of duplicates. Myc-GnT1IP-S and GlcNAcT-I-HA levels were determined by immunoblotting with actin as loading control. (E) GlcNAcT-I, GlcNAcT-III, and β4GalT specific activities (SA) in lysates from CHO and LEC10 cells stably expressing control vector or the GnT1IP construct shown. GnT1IP transfectants were GNA-sorted. Bars represent range (n = 2).
Figure 4.
Figure 4.
GnT1IP-L localizes to the ER, ERGIC, and Golgi. (A–C) HeLa cells transiently expressing different GnT1IP constructs were fixed, immunolabeled for Myc-tagged GnT1IP-L (red) and GM130 or PDI (green), or HA-tagged GnT1IP-L (green) and ERGIC-53 (red), followed by confocal microscopy (A and C) or fluorescence microscopy (B). (D) HeLa cells transiently expressing HA-GnT1IP-L or GlcNAcT-I-HA were treated with CHX for 45 min followed by BFA for 30 min, fixed, immunolabeled for HA-GnT1IP-L or GlcNAcT-I-HA (green) and ERGIC-53 (red), and analyzed by fluorescence microscopy. Bars, 10 µm.
Figure 5.
Figure 5.
GnT1IP mislocalizes GlcNAcT-I-HA. (A) Myc-GnT1IP-L and -S were transiently coexpressed with GlcNAcT-I-HA in HeLa cells, fixed, immunolabeled for Myc (red) and for HA (green), and examined by confocal microscopy. Bars 10 µm. (B) Quantitation of effects of transiently expressed Myc-GnT1IP-L, Myc-GnT1Ip-S, or Myc-GnT1IP-S-CD1 on the localization of GlcNAcT-I-HA stably expressed in Lec1 cells. Localization in ∼300 cells per condition was classified into ER (E), more ER than Golgi (E/G), more Golgi than ER (G/E), or Golgi (G), and compared with Lec1 cells stably expressing GlcNAcT-I-HA alone. Error bars = SD; n = 3. (C) Deletion mutants of GnT1IP were coexpressed with GlcNAcT-I-HA in HeLa cells, fixed, immunolabeled for Myc (red) and for HA (green), and examined by immunofluoresence (top) or confocal microscopy (bottom). (D) Myc-GnT1IP-L was transiently expressed in HeLa cells, fixed, immunolabeled for Myc-GnT1IP-L (red) and endogenous ManII or β4GalT-I (green), and observed by fluorescence or confocal microscopy. (E) Myc-GnT1IP-L was either transiently expressed alone or coexpressed with GlcNAcT-I-HA in HeLa cells overnight, CHX was added for 1 h, followed by CHX and BFA for 30 min, cells were fixed, immunolabeled for Myc-GnT1IP-L (red) and GlcNAcT-I-HA or endogenous ManII (green), and observed by fluorescence microscopy. White boxes in the middle panel are enlarged below. Bars, 10 µm.
Figure 6.
Figure 6.
GlcNAcT-I-KDEL localized mainly in the ER is active. Lec1 cells stably expressing empty vector, GlcNAcT-I-HA-KDEL, or GlcNAcT-I-HA were analyzed for (A) Con A resistance and (B) L-PHA-FITC binding by flow cytometry. (C) GlcNAcT-I and β4GalT activities in transfectant lysates were determined. Bars represent range (n = 2). (D) HeLa cells transiently expressing GlcNAcT-I-HA-KDEL were fixed and immunofluorescently labeled for GlcNAcT-I-HA-KDEL (red) and endogenous ManII (green). Bars, 10 µm.
Figure 7.
Figure 7.
GnT1IP-L interacts with medial-Golgi but not trans-Golgi enzymes. (A) Myc-GnT1IP-L or (B) Myc-GnT1IP-S were coexpressed with GlcNAcT-I-HA, GlcNAcT-III-HA, ManIIx-HA, β4GalT-I lacking 13 N-terminal amino acids (SGT-HA), or aa 321–600 of the p85 subunit of PI3 kinase (HA-p85ni) in CHO cells. Lysates were immunoprecipitated with anti-Myc beads, and 40% of the beads were analyzed by immunoblotting on two blots (IP-Myc with IB-HA or IB-Myc). Input (1/40th lysate) was immunoblotted with IB-HA or IB-Myc. (C) GlcNAcT-I-Myc was coexpressed with HA-GnT1IP-L, GlcNAcT-III-HA, ManIIx-HA, or SGT-HA in CHO cells and lysates were treated as in A. ▲, Fragment of GlcNAcT-III-HA not bound by GnT1IP; #, position or predicted position of HA-p85ni; *, immunoglobulin light chains from anti-Myc beads show equal concentration of beads.
Figure 8.
Figure 8.
GnT1IP expression is regulated during spermatogenesis and enhances binding to Sertoli cells. (A) Diagram of GnT1IP cDNA and primer pairs for RT-PCR. (B and C) Total RNA from spermatocytes and spermatids partially purified from testes at postnatal day 11 (11 d) to 13 wk (13 w) was subjected to RT-PCR. Primer pair 6 detected only GnT1IP-L; pair 7 detected both GnT1IP-L and -S. Actin primers generated a 280-bp cDNA or 320-bp product from genomic DNA (*). Primer pairs 4 and 8 detected GnT1IP-L and -S coding regions. (D) Equal numbers of CHO cells stably expressing vector GFP, Myc-GnT1IP-S, HA-GnT1IP-L, or Lec1 cells labeled with CFDA-SE were assayed for binding to TM4 Sertoli cells. Images of wells after washing were taken by fluorescence microscopy (FITC channel merged with phase contrast, 10x). Bars, 40 µm. (E) Three pictures taken from fields similar to those shown in D close to the center of each well were processed by NIH ImageJ software, green cells were counted, and triplicates averaged. Error bars = SD; n = 4 experiments. **, P < 0.01; *, P < 0.05 based on the two-tailed Student’s t test. (F) Lec1 cells expressing GlcNAcT-I-HA selected for hygromycin resistance or sorted for L-PHA binding (GlcNAcT-I-HAL-PHA) were tested for binding to TM4 Sertoli cells as in D. Bars represent range (n = 2).
Figure 9.
Figure 9.
Summary diagram. The relative levels of GnT1IP-L and GlcNAcT-I transcripts in germ cells vary during spermatogenesis as indicated (Chalmel et al., 2007; Fig. 8), and the N-glycans on germ cells vary as shown by changes in lectin binding (Jones et al., 1992). In spermatogonia, negligible levels of the new GlcNAcT-I inhibitor GnT1IP-L described herein, and high GlcNAcT-I leads to the synthesis of complex N-glycans. In spermatocytes, increased expression of GnT1IP-L accompanied by down-regulation of GlcNAcT-I leads to the expression of high mannose N-glycans on germ cell glycoproteins. This change in N-glycans is predicted to enhance the binding of spermatocytes to Sertoli cells (Fig. 8). At later stages of spermatogenesis GnT1IP-L expression levels decrease while GlcNAcT-I levels increase, and spermatids express complex N-glycans and have reduced binding to Sertoli cells.

Similar articles

Cited by

References

    1. Akama T.O., Nakagawa H., Sugihara K., Narisawa S., Ohyama C., Nishimura S., O’Brien D.A., Moremen K.W., Millan J.L., Fukuda M.N.. 2002. Germ cell survival through carbohydrate-mediated interaction with Sertoli cells. Science. 295:124–127. 10.1126/science.1065570 - DOI - PubMed
    1. Akama T.O., Nakagawa H., Wong N.K., Sutton-Smith M., Dell A., Morris H.R., Nakayama J., Nishimura S., Pai A., Moremen K.W., et al. . 2006. Essential and mutually compensatory roles of alpha-mannosidase II and alpha-mannosidase IIx in N-glycan processing in vivo in mice. Proc. Natl. Acad. Sci. USA. 103:8983–8988. 10.1073/pnas.0603248103 - DOI - PMC - PubMed
    1. Akasaka-Manya K., Manya H., Nakajima A., Kawakita M., Endo T.. 2006. Physical and functional association of human protein O-mannosyltransferases 1 and 2. J. Biol. Chem. 281:19339–19345. 10.1074/jbc.M601091200 - DOI - PubMed
    1. Aryal R.P., Ju T., Cummings R.D.. 2010. The endoplasmic reticulum chaperone Cosmc directly promotes in vitro folding of T-synthase. J. Biol. Chem. 285:2456–2462. 10.1074/jbc.M109.065169 - DOI - PMC - PubMed
    1. Bhattacharyya R., Bhaumik M., Raju T.S., Stanley P.. 2002. Truncated, inactive N-acetylglucosaminyltransferase III (GlcNAc-TIII) induces neurological and other traits absent in mice that lack GlcNAc-TIII. J. Biol. Chem. 277:26300–26309. 10.1074/jbc.M202276200 - DOI - PubMed

Publication types

Substances