. 2010 Sep 14;107(37):16348-53.
doi: 10.1073/pnas.1006021107. Epub 2010 Aug 30.

Image-matching during ant navigation occurs through saccade-like body turns controlled by learned visual features

Affiliations

Image-matching during ant navigation occurs through saccade-like body turns controlled by learned visual features

David D Lent et al. Proc Natl Acad Sci U S A. .

Abstract

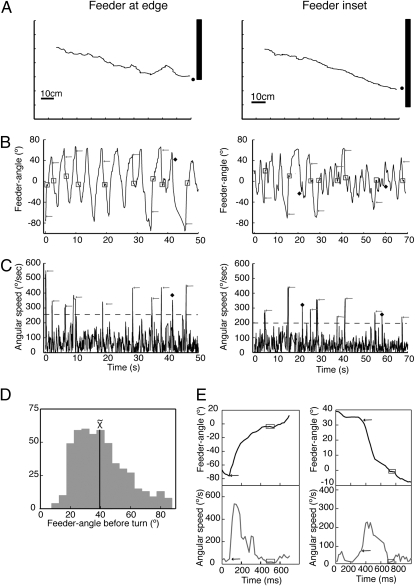
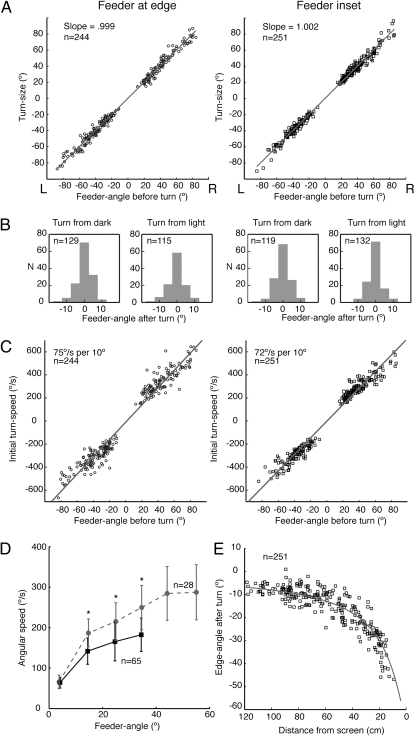
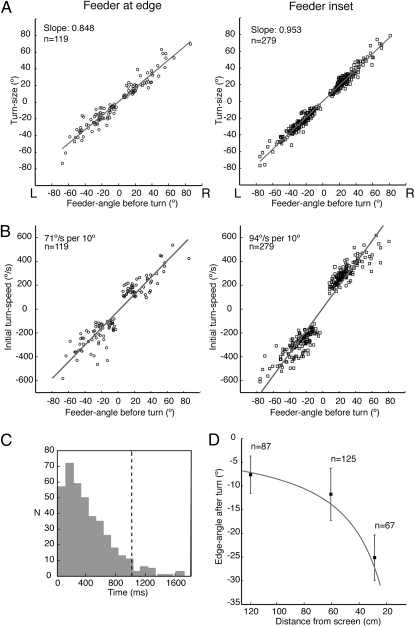
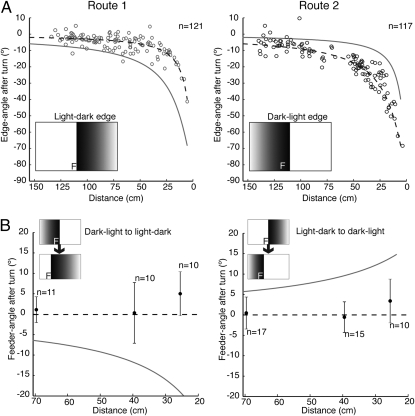
Visual memories of landmarks play a major role in guiding the habitual foraging routes of ants and bees, but how these memories engage visuo-motor control systems during guidance is poorly understood. We approach this problem through a study of image matching, a navigational strategy in which insects reach a familiar place by moving so that their current retinal image transforms to match a memorized snapshot of the scene viewed from that place. Analysis of how navigating wood ants correct their course when close to a goal reveals a significant part of the mechanism underlying this transformation. Ants followed a short route to an inconspicuous feeder positioned at a fixed distance from a vertical luminance edge. They responded to an unexpected jump of the edge by turning to face the new feeder position specified by the edge. Importantly, the initial speed of the turn increased linearly with the turn's amplitude. This correlation implies that the ants' turns are driven initially by their prior calculation of the angular difference between the current retinal position of the edge and its desired position in their memorized view. Similar turns keep ants to their path during unperturbed routes. The neural circuitry mediating image-matching is thus concerned not only with the storage of views, but also with making exact comparisons between the retinal positions of a visual feature in a memorized view and of the same feature in the current retinal image.


Conflict of interest statement

The authors declare no conflict of interest.

Figures

Fig. 1.
Fig. 1.
Approaches to a feeder defined by a luminance edge. (A) Two sample paths. (B and C) Plots of feeder-angle and angular speed during the course of these paths. Horizontal dashed line in C shows threshold for measuring turns at 2 SD above the mean angular speed (mean speed with feeder at edge is 120° per s−1 ± 75° per s−1 SD; mean with feeder inset is 107° per s−1 ± 45° per s−1 SD). Note that the onset of the rapid turn often occurs after the feeder-angle has peaked. Arrows show the onset of turns and the boxes their end. Filled diamonds show peaks that did not correspond to identifiable turns (see Materials and Methods). (AC) (Left) Data from routes with the feeder at the base of the edge; (Right) Routes with feeder inset. (D) Distribution of absolute values of feeder-angles before a turn. Data come from 495 approaches. (E) Plots of turns at high resolution. The start of a turn is specified by the sudden increase in angular velocity and its end by at least three frames over which the ant's body orientation changes by <1°. Boxes and arrows defined as above.
Fig. 2.
Fig. 2.
Turn-sizes and speeds. (A) Plot of turn-size against feeder-angle before turn with linear fits to these data (r2 feeder at base = 0.991; r2 feeder inset = 0.991). Here and throughout the article, negative angles indicate turns to the ant's left and positive to its right. (B) Distribution of feeder-angles after the turn, separated according to whether ants face the dark or the light side of the edge at the onset of the turn. (C) Plots of initial turn-speed against feeder-angle before the turn with linear fits to these data (r2 feeder at edge = 0.959; r2 feeder inset = 0.970). (A–C) (Left) Data from routes with the feeder at the base of the edge; (Right) Routes with feeder inset. (D) Plots of angular speed against feeder-angle during turns of two size ranges. As the turns progress, the feeder-angle falls, accompanied by a drop in angular speed. Speeds between the two size ranges differ until the feeder-angle is less than 20°. Dashed line: starting feeder-angle lies between 60 and 70°, solid line feeder-angle lies between 40 and 50°. Angular speed is averaged over 10° bins of feeder-angle within each size range. To pool data from turns of both directions, anticlockwise turns are reflected. Data points showing mean values and error bars (±1 SD) are placed at the center of each bin. Asterisk (*) indicates difference between speeds is significant at P < 0.01 (t test). (E) For routes with inset feeder, edge-angle after a turn is plotted against the ants’ distance from the screen. Data cluster around the calculated solid line that gives the edge-angle corresponding to 0° feeder-angle along the route.
Fig. 3.
Fig. 3.
Turns induced by jumps of the edge. (A) Plots of turn-size against feeder-angle before turn with linear fits to the data (r2 feeder at edge = 0.865; r2 feeder inset = 0.928). (B) Plots of initial turn-speed against feeder-angle before turn with linear fits to the data (r2 feeder at base = 0.898; r2 feeder inset = 0.919). (C) Delay between edge-jump and turn combining all tests. Turns with delays beyond the dashed line at ∼2 SD were not analyzed. (D) For routes with inset feeder, mean and SD of edge-angle after turn are plotted against distance from screen at onset of turn. The solid line shows calculated edge-angle for 0° feeder-angle.
Fig. 4.
Fig. 4.
Ants trained to two routes. (Left) Route 1. (Right) Route 2. (A) Turns during training runs. Edge-angle after a turn is plotted against the ant's distance from the screen for the two routes. Dashed curve shows edge-angle corresponding to 0° feeder-angle along the currently appropriate route. Ants follow this dashed curve significantly better than the solid curve for the alternate route (paired t test on the distance of each point from predicted curve, P < 0.0001 in both cases). (Insets) Position of feeder (F) relative to edge. (B) Turns induced by edge jumps. Data show mean (± SD) feeder-angle at the end of turns, which were evoked when ants were 70, 40, or 26 cm from the screen. Horizontal dashed line represents 0° feeder-angle for the replacement edge. Solid curve gives the predicted 0° feeder-angle for the same sized stimulus jump, but without switch of edge polarity. Insets show display on LCD screen before and after stimulus jump.

References

    1. von Frisch K. The Dance Language and Orientation of Bees. London: Oxford University Press; 1967.
    1. Menzel R, et al. The knowledge base of bee navigation. J Exp Biol. 1996;199:141–146. - PubMed
    1. Collett TS, Collett M. Memory use in insect visual navigation. Nat Rev Neurosci. 2002;3:542–552. - PubMed
    1. Kohler M, Wehner R. Idiosyncratic route-based memories in desert ants, Melophorus bagoti: How do they interact with path-integration vectors? Neurobiol Learn Mem. 2005;83:1–12. - PubMed
    1. Collett TS, Collett M, Wehner R. The guidance of desert ants by extended landmarks. J Exp Biol. 2001;204:1635–1639. - PubMed

Publication types