

Seasonal prevalence of MS disease activity
- PMID: 20805526
- PMCID: PMC2938966
- DOI: 10.1212/WNL.0b013e3181f0734c
Seasonal prevalence of MS disease activity
Abstract
Objective: This observational cohort study investigated the seasonal prevalence of multiple sclerosis (MS) disease activity (likelihood and intensity), as reflected by new lesions from serial T2-weighted MRI, a sensitive marker of subclinical disease activity.
Methods: Disease activity was assessed from the appearance of new T2 lesions on 939 separate brain MRI examinations in 44 untreated patients with MS. Likelihood functions for MS disease activity were derived, accounting for the temporal uncertainty of new lesion occurrence, individual levels of disease activity, and uneven examination intervals. Both likelihood and intensity of disease activity were compared with the time of year (season) and regional climate data (temperature, solar radiation, precipitation) and among relapsing and progressive disease phenotypes. Contrast-enhancing lesions and attack counts were also compared for seasonal effects.
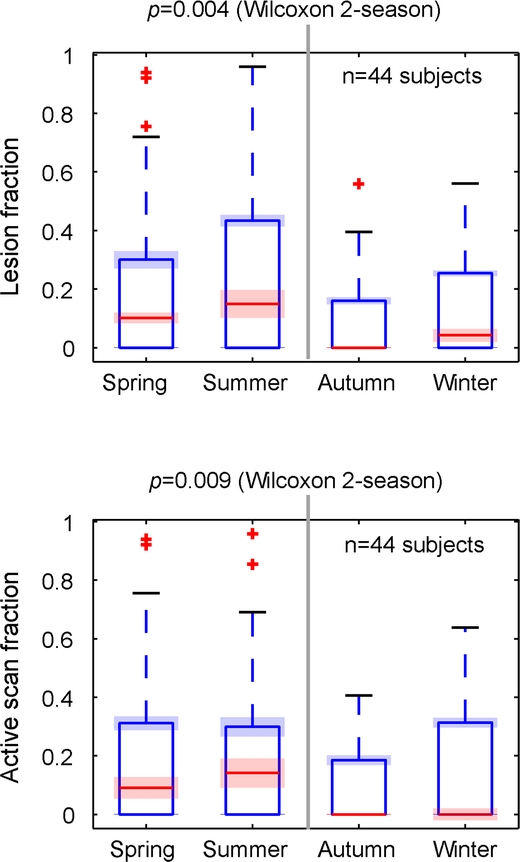
Results: Unlike contrast enhancement or attacks, new T2 activity revealed a likelihood 2-3 times higher in March-August than during the rest of the year, and correlated strongly with regional climate data, in particular solar radiation. In addition to the likelihood or prevalence, disease intensity was also elevated during the summer season. The elevated risk season appears to lessen for progressive MS and occur about 2 months earlier.
Conclusion: This study documents evidence of a strong seasonal pattern in subclinical MS activity based on noncontrast brain MRI. The observed seasonality in MS disease activity has implications for trial design and therapy assessment. The observed activity pattern is suggestive of a modulating role of seasonally changing environmental factors or season-dependent metabolic activity.
Figures


Comment in
-
The four seasons of multiple sclerosis.Neurology. 2010 Aug 31;75(9):762-3. doi: 10.1212/WNL.0b013e3181f313ec. Neurology. 2010. PMID: 20805521 No abstract available.
References
-
- Bamford CR, Sibley WA, Thies C. Seasonal variation of multiple sclerosis exacerbations in Arizona. Neurology 1983;33:697–701. - PubMed
-
- Ogawa G, Mochizuki H, Kanzaki M, Kaida K, Motoyoshi K, Kamakura K. Seasonal variation of multiple sclerosis exacerbations in Japan. Neurol Sci 2004;24:417–419. - PubMed
-
- Wüthrich R, Rieder HP. The seasonal incidence of multiple sclerosis in Switzerland. Eur Neurol 1970;3:257–264. - PubMed
-
- Jin YP, de Pedro-Cuesta J, Soderstrom M, Link H. Incidence of optic neuritis in Stockholm, Sweden, 1990–1995: II: time and space patterns. Arch Neurol 1999;56:975–980. - PubMed
Publication types
MeSH terms
Grants and funding
- R01 AG027437/AG/NIA NIH HHS/United States
- P01AG004390/AG/NIA NIH HHS/United States
- K23NS052553/NS/NINDS NIH HHS/United States
- R01NS055083-01A1/NS/NINDS NIH HHS/United States
- R01 AG022092-01/AG/NIA NIH HHS/United States
- UL1 RR025758-01/RR/NCRR NIH HHS/United States
- UL1 RR025758/RR/NCRR NIH HHS/United States
- P01 NS 038037-06A2/NS/NINDS NIH HHS/United States
- R01 AI43458/AI/NIAID NIH HHS/United States
- 2U01AI063623-06/AI/NIAID NIH HHS/United States
- R01 AI043458/AI/NIAID NIH HHS/United States
- R01 NS036524-05/NS/NINDS NIH HHS/United States
- 2P41RR013218/RR/NCRR NIH HHS/United States
- K23 NS052553/NS/NINDS NIH HHS/United States
- P41 RR013218/RR/NCRR NIH HHS/United States
- P01 NS038037/NS/NINDS NIH HHS/United States
- N01-NS-0-2397/NS/NINDS NIH HHS/United States
LinkOut - more resources
Full Text Sources