. 2010 Nov;186(3):1067-75.
doi: 10.1534/genetics.110.119586. Epub 2010 Aug 30.

Extended Bayesian LASSO for multiple quantitative trait loci mapping and unobserved phenotype prediction

Affiliations

Extended Bayesian LASSO for multiple quantitative trait loci mapping and unobserved phenotype prediction

Crispin M Mutshinda et al. Genetics. 2010 Nov.

Abstract

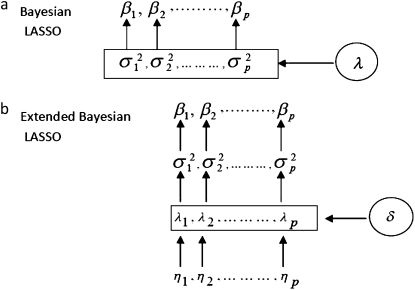
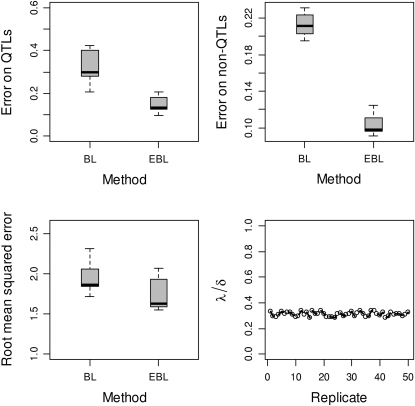
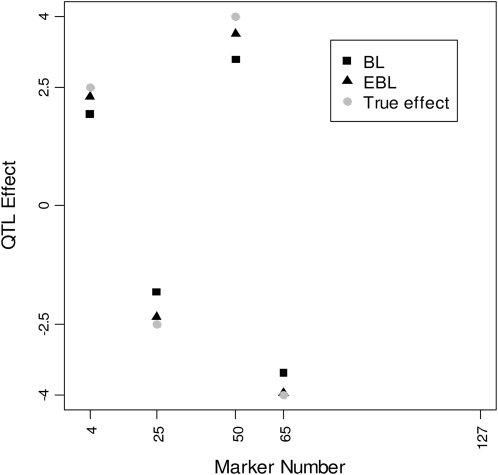
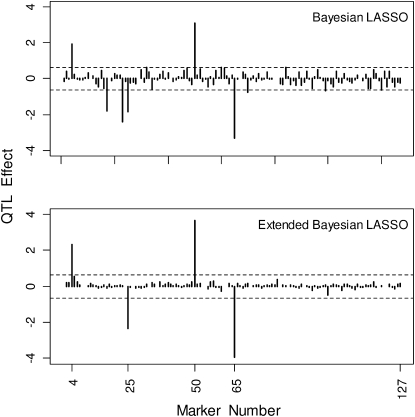
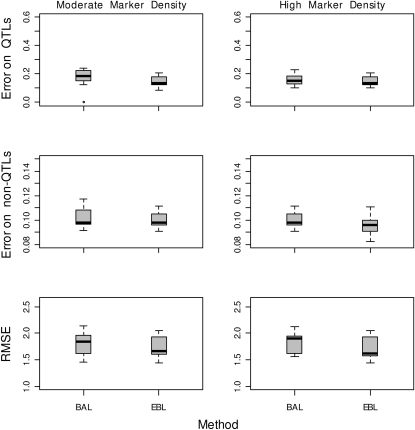
The Bayesian LASSO (BL) has been pointed out to be an effective approach to sparse model representation and successfully applied to quantitative trait loci (QTL) mapping and genomic breeding value (GBV) estimation using genome-wide dense sets of markers. However, the BL relies on a single parameter known as the regularization parameter to simultaneously control the overall model sparsity and the shrinkage of individual covariate effects. This may be idealistic when dealing with a large number of predictors whose effect sizes may differ by orders of magnitude. Here we propose the extended Bayesian LASSO (EBL) for QTL mapping and unobserved phenotype prediction, which introduces an additional level to the hierarchical specification of the BL to explicitly separate out these two model features. Compared to the adaptiveness of the BL, the EBL is "doubly adaptive" and thus, more robust to tuning. In simulations, the EBL outperformed the BL in regard to the accuracy of both effect size estimates and phenotypic value predictions, with comparable computational time. Moreover, the EBL proved to be less sensitive to tuning than the related Bayesian adaptive LASSO (BAL), which introduces locus-specific regularization parameters as well, but involves no mechanism for distinguishing between model sparsity and parameter shrinkage. Consequently, the EBL seems to point to a new direction for QTL mapping, phenotype prediction, and GBV estimation.


Figures

F<sc>igure</sc> 1.—
Figure 1.—
Graphical representation of the hierarchical specification of the priors of the locus-specific effects in the BL (a) and the EBL (b), illustrating the roles and scopes of each hyperparameters: λ in the BL and δ and ηj in the EBL.
F<sc>igure</sc> 2.—
Figure 2.—
Performance evaluation of the EBL and the BL over 50 replicated data sets using the Barley marker data. The results are summarized by the posterior means over 50 replicated data sets. Top left: the estimation errors (differences between the posterior means and known true values) with regard to true signals i.e., QTL. Top right: the estimation errors with regard to false signals i.e., non-QTL. Bottom left: predictive root mean square errors for the BL and the EBL. Bottom right: the ratios of posterior means of λ (in the BL) and δ (in the EBL) over 50 replicated data sets, illustrating the correspondence between the roles of these two locus-independent parameters (λ and δ) in the two methods.
F<sc>igure</sc> 3.—
Figure 3.—
Posterior means of estimated QTL effects for the BL (solid squares) and the EBL (solid triangles) at QTL positions, along with their true effects (shaded circles). The plotted values represent the posterior means averaged over 50 replicated data sets based on the Barley marker data.
F<sc>igure</sc> 4.—
Figure 4.—
Posterior means of all marker effects averaged over the 50 replicated data sets based on the Barley marker data for the BL and the EBL. The dashed lines indicate the permutation-based QTL significance thresholds.
F<sc>igure</sc> 5.—
Figure 5.—
Performance evaluation of the EBL and the BAL on the Barley marker data (left), and a simulated dense marker data set (right). The results are summarized by boxplots of posterior means over 50 replicated data sets. Top: the estimation errors (differences between the posterior means and known true values) for true signals i.e., QTL. Middle: the estimation errors with regard to false signals i.e., non-QTL. Bottom: predictive root mean square errors.
F<sc>igure</sc> 6.—
Figure 6.—
Typical patterns of posterior means of marker effects for different hyperparameter values under our simulation setting based on the Barley marker data with QTL at loci 4, 25, 50, and 65 with respective effects 2, −2, 4, and −4. The results are based on 10,000 MCMC iterations, with the first 4000 samples discarded as burn-in.

Similar articles

Cited by

References

    1. Churchill, G. A., and R. W. Doerge, 1994. Empirical threshold values for quantitative trait mapping. Genetics 138 963–971. - PMC - PubMed
    1. De los Campos, G., H. Naya, D. Gianola, J. Crossa, A. Legarra et al., 2009. Predicting quantitative traits with regression models for dense molecular markers and pedigree. Genetics 182 375–385. - PMC - PubMed
    1. Gilks, W.R., S. Richardson and D. J. Spiegelhalter, 1996. Markov Chain Monte Carlo in Practice. Chapman & Hall, London.
    1. Hoerl, A. E., and R. W. Kennard, 1970. Ridge regression: biased estimation for nonorthogonal problems. Technometrics 12 55–67.
    1. Lee, S. H., J. H. J. Van der Werf, B. J. Hayes, M. E. Goddard and P. M. Visscher, 2008. Predicting unobserved phenotypes for complex traits from whole-genome SNP data. PLoS Genet. 4 e1000231. - PMC - PubMed

Publication types

Substances