

The non-equilibrium thermodynamics and kinetics of focal adhesion dynamics
- PMID: 20805876
- PMCID: PMC2923603
- DOI: 10.1371/journal.pone.0012043
The non-equilibrium thermodynamics and kinetics of focal adhesion dynamics
Abstract
Background: We consider a focal adhesion to be made up of molecular complexes, each consisting of a ligand, an integrin molecule, and associated plaque proteins. Free energy changes drive the binding and unbinding of these complexes and thereby controls the focal adhesion's dynamic modes of growth, treadmilling and resorption.
Principal findings: We have identified a competition among four thermodynamic driving forces for focal adhesion dynamics: (i) the work done during the addition of a single molecular complex of a certain size, (ii) the chemical free energy change associated with the addition of a molecular complex, (iii) the elastic free energy change associated with deformation of focal adhesions and the cell membrane, and (iv) the work done on a molecular conformational change. We have developed a theoretical treatment of focal adhesion dynamics as a nonlinear rate process governed by a classical kinetic model. We also express the rates as being driven by out-of-equilibrium thermodynamic driving forces, and modulated by kinetics. The mechanisms governed by the above four effects allow focal adhesions to exhibit a rich variety of behavior without the need to introduce special constitutive assumptions for their response. For the reaction-limited case growth, treadmilling and resorption are all predicted by a very simple chemo-mechanical model. Treadmilling requires symmetry breaking between the ends of the focal adhesion, and is achieved by driving force (i) above. In contrast, depending on its numerical value (ii) causes symmetric growth, resorption or is neutral, (iii) causes symmetric resorption, and (iv) causes symmetric growth. These findings hold for a range of conditions: temporally-constant force or stress, and for spatially-uniform and non-uniform stress distribution over the FA. The symmetric growth mode dominates for temporally-constant stress, with a reduced treadmilling regime.
Significance: In addition to explaining focal adhesion dynamics, this treatment can be coupled with models of cytoskeleton dynamics and contribute to the understanding of cell motility.
Conflict of interest statement
Figures
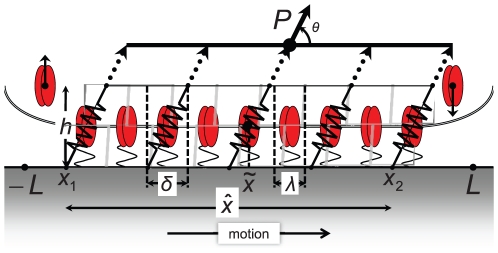
 in the
  -direction and their elastic response is represented by the springs. The elastic elements have length
  along the
  -direction. (Note that
  is an arbitrary length and has no effect on the potential; see the section titled “Driving force due to elasticity”.) The dotted arrows are actin stress fibers, which transfer force to the attached complexes. The bundle of actin stress fibers transmits total force
  . Also shown are the proximal and distal ends,
  , the centroid
  , length
  and domain boundaries
  .
.
 and
and  at the distal and proximal ends, respectively. The schematic diagrams indicate the dynamics corresponding to each regime. Note the various modes attained as
  is varied.
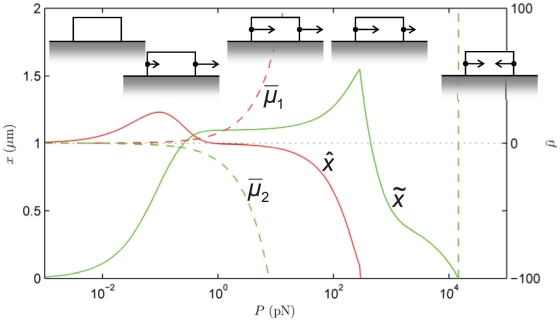
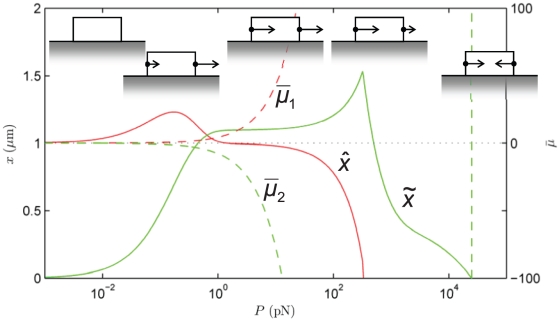
 , and length,
  at
at  s as a function of total force,
  . The other parameters are as in Fig. 4, with which this state diagram should be compared. Also shown are the normalized chemical potentials,
  and
and  at the distal and proximal ends, respectively.
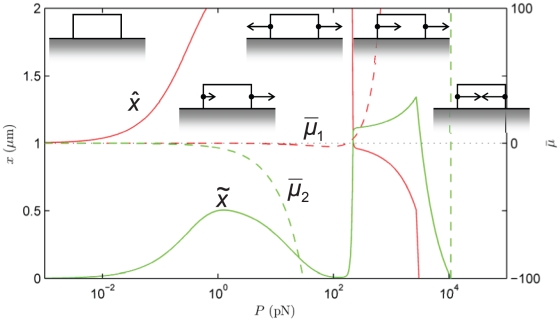
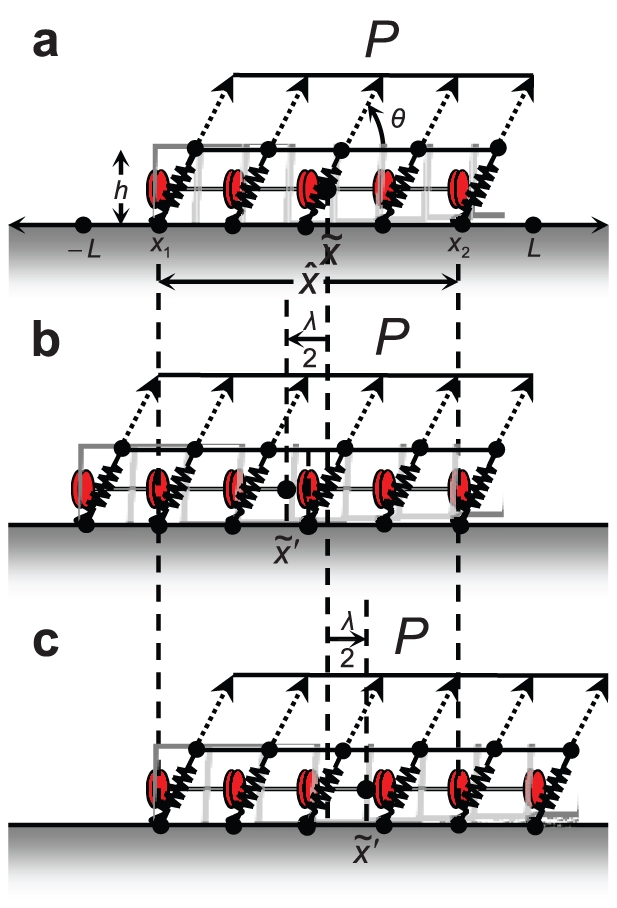
 and (b)
  . In comparison,
  in Fig. 4. The other parameters are as in Fig. 4, with which this state diagram should be compared.
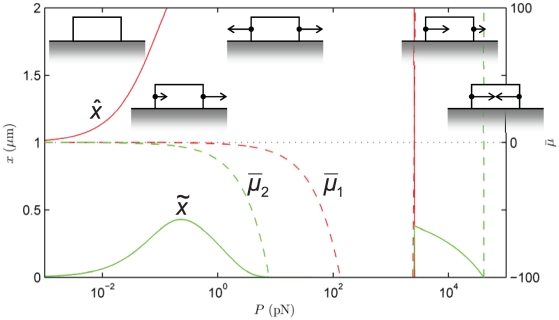
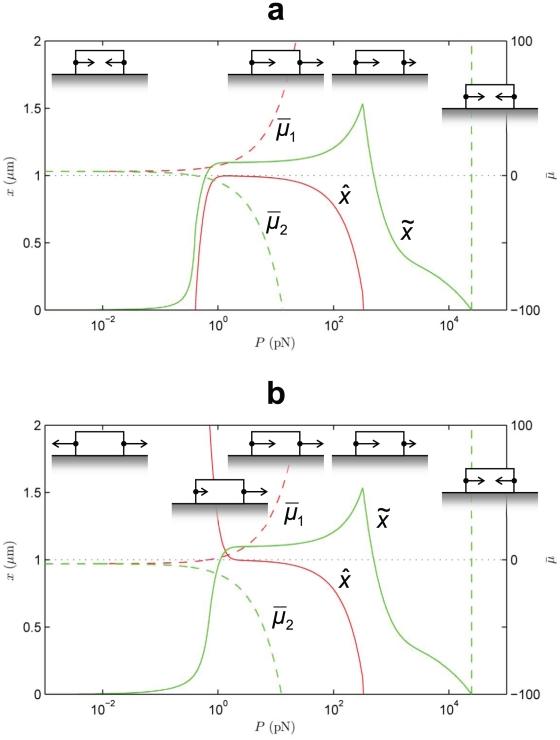
 nm from
  nm assumed in Fig. 4. The other parameters are as in Fig. 4, with which this state diagram should be compared.
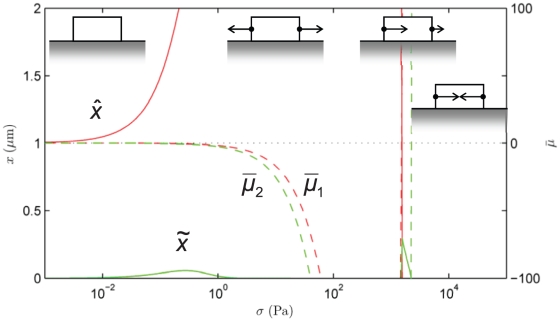
 ,
,  , with other parameters are as in Fig. 4, with which this state diagram could be compared. The main effect of stress-control on FA dynamics is that the symmetric growth mode is strongly favored over most low stress values, as seen by the growth of
  . However, the Treadmilling Mode does hold over a narrow range for
  kPa, which compares well with the stress of
  kPa reported by Balaban and co-workers . The Treadmilling Mode gets suppressed for less polarized strains
  relative to
  .
.Similar articles
-
Focal adhesions as mechanosensors: a physical mechanism.Proc Natl Acad Sci U S A. 2005 Aug 30;102(35):12383-8. doi: 10.1073/pnas.0500254102. Epub 2005 Aug 19. Proc Natl Acad Sci U S A. 2005. PMID: 16113084 Free PMC article.
-
Assembly and mechanosensory function of focal adhesions: experiments and models.Eur J Cell Biol. 2006 Apr;85(3-4):165-73. doi: 10.1016/j.ejcb.2005.11.001. Epub 2005 Dec 19. Eur J Cell Biol. 2006. PMID: 16360240 Review.
-
A Chemomechanical Model of Matrix and Nuclear Rigidity Regulation of Focal Adhesion Size.Biophys J. 2015 Nov 3;109(9):1807-17. doi: 10.1016/j.bpj.2015.08.048. Biophys J. 2015. PMID: 26536258 Free PMC article.
-
A computational study of stress fiber-focal adhesion dynamics governing cell contractility.Biophys J. 2014 May 6;106(9):1890-901. doi: 10.1016/j.bpj.2014.03.027. Biophys J. 2014. PMID: 24806921 Free PMC article.
-
Insights into adhesion biology using single-molecule localization microscopy.Chemphyschem. 2014 Mar 17;15(4):606-18. doi: 10.1002/cphc.201301041. Epub 2014 Feb 4. Chemphyschem. 2014. PMID: 24497323 Review.
Cited by
-
Dynamics of Mechanosensitive Nascent Adhesion Formation.Biophys J. 2019 Sep 17;117(6):1057-1073. doi: 10.1016/j.bpj.2019.08.004. Epub 2019 Aug 12. Biophys J. 2019. PMID: 31493858 Free PMC article.
-
A kinetic model for RNA-interference of focal adhesions.BMC Syst Biol. 2013 Jan 12;7:2. doi: 10.1186/1752-0509-7-2. BMC Syst Biol. 2013. PMID: 23311633 Free PMC article.
-
A continuum mechanical model of cell motion driven by a biphasic traction stress.J R Soc Interface. 2024 Jan;21(210):20230543. doi: 10.1098/rsif.2023.0543. Epub 2024 Jan 17. J R Soc Interface. 2024. PMID: 38228181 Free PMC article.
-
Nucleation and decay initiation are the stiffness-sensitive phases of focal adhesion maturation.Biophys J. 2011 Dec 21;101(12):2919-28. doi: 10.1016/j.bpj.2011.11.010. Epub 2011 Dec 20. Biophys J. 2011. PMID: 22208190 Free PMC article.
-
Cells on Hydrogels with Micron-Scaled Stiffness Patterns Demonstrate Local Stiffness Sensing.Nanomaterials (Basel). 2022 Feb 15;12(4):648. doi: 10.3390/nano12040648. Nanomaterials (Basel). 2022. PMID: 35214978 Free PMC article.
References
-
- Zamir E, Geiger B. Molecular complexity and dynamics of cell-matrix adhesions. J Cell Sci. 2001;114:3583–3590. - PubMed
-
- Zaidel-Bar R, Ballestrem C, Kam Z, Geiger B. Early molecular events in the assembly of matrix adhesions at the leading edge of migrating cells. J Cell Sci. 2003;116:4605–4613. - PubMed
-
- Balaban NQ, Schwarz US, Riveline D, Goichberg P, Tzur G, et al. Force and focal adhesion assembly: a close relationship studied using elastic micropatterned substrates. Nat Cell Biol. 2001;3:466–473. - PubMed
-
- Johnson RP, Craig SW. F-actin binding site masked by the intramolecular association of vinculin head and tail domains. Nature. 1995;373:261–264. - PubMed
Publication types
MeSH terms
LinkOut - more resources
Full Text Sources
