. 2010 Aug 18;5(8):e12262.
doi: 10.1371/journal.pone.0012262.

Cancer biomarker discovery: the entropic hallmark

Affiliations

Cancer biomarker discovery: the entropic hallmark

Regina Berretta et al. PLoS One. .

Abstract

Background: It is a commonly accepted belief that cancer cells modify their transcriptional state during the progression of the disease. We propose that the progression of cancer cells towards malignant phenotypes can be efficiently tracked using high-throughput technologies that follow the gradual changes observed in the gene expression profiles by employing Shannon's mathematical theory of communication. Methods based on Information Theory can then quantify the divergence of cancer cells' transcriptional profiles from those of normally appearing cells of the originating tissues. The relevance of the proposed methods can be evaluated using microarray datasets available in the public domain but the method is in principle applicable to other high-throughput methods.

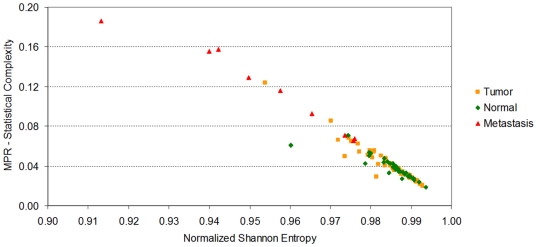
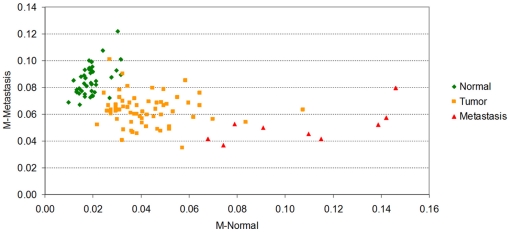
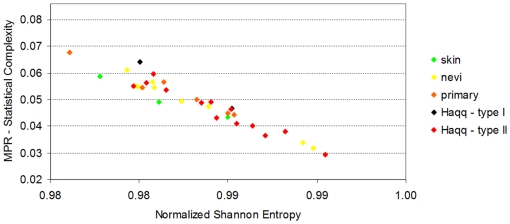
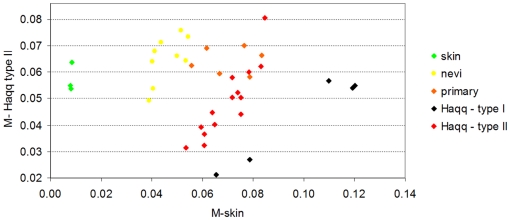
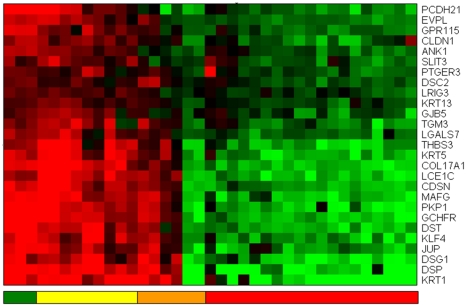
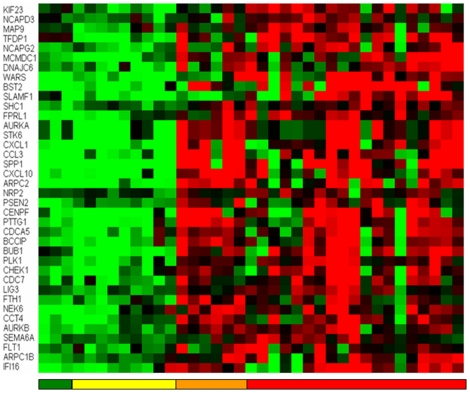
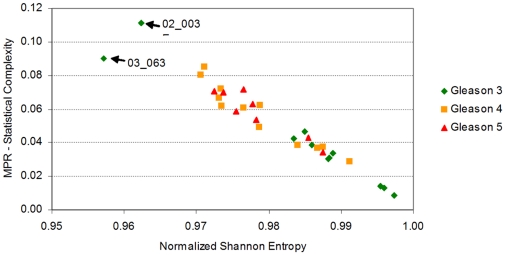
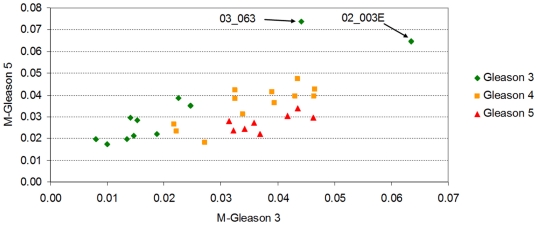
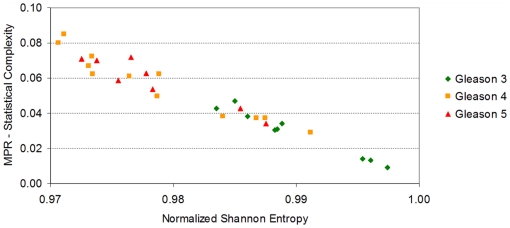
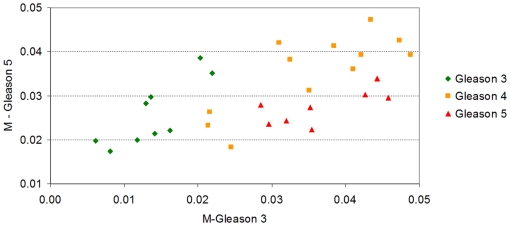
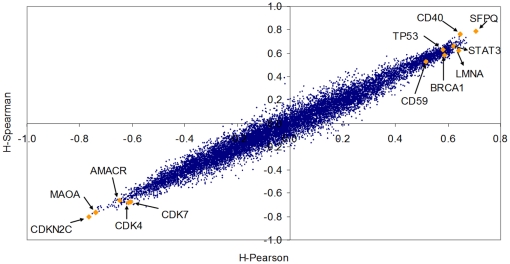
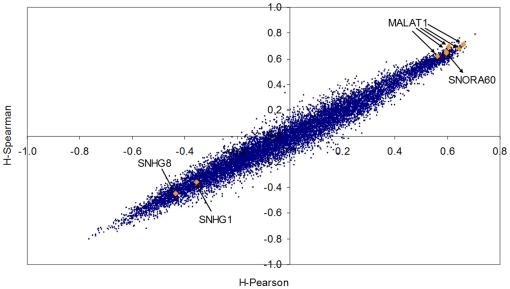
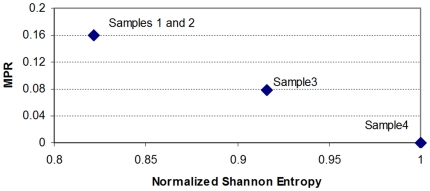
Methodology/principal findings: Using melanoma and prostate cancer datasets we illustrate how it is possible to employ Shannon Entropy and the Jensen-Shannon divergence to trace the transcriptional changes progression of the disease. We establish how the variations of these two measures correlate with established biomarkers of cancer progression. The Information Theory measures allow us to identify novel biomarkers for both progressive and relatively more sudden transcriptional changes leading to malignant phenotypes. At the same time, the methodology was able to validate a large number of genes and processes that seem to be implicated in the progression of melanoma and prostate cancer.

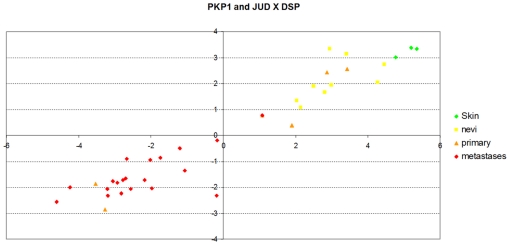
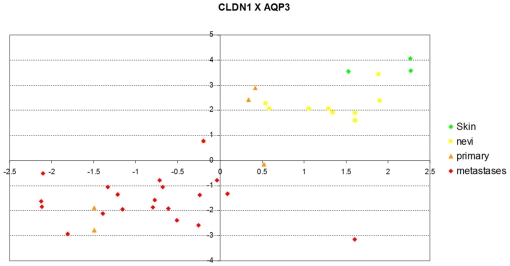
Conclusions/significance: We thus present a quantitative guiding rule, a new unifying hallmark of cancer: the cancer cell's transcriptome changes lead to measurable observed transitions of Normalized Shannon Entropy values (as measured by high-throughput technologies). At the same time, tumor cells increment their divergence from the normal tissue profile increasing their disorder via creation of states that we might not directly measure. This unifying hallmark allows, via the the Jensen-Shannon divergence, to identify the arrow of time of the processes from the gene expression profiles, and helps to map the phenotypical and molecular hallmarks of specific cancer subtypes. The deep mathematical basis of the approach allows us to suggest that this principle is, hopefully, of general applicability for other diseases.


Conflict of interest statement

Competing Interests: The authors have declared that no competing interests exist.

Figures

Figure 1
Figure 1. The Normalized Shannon Entropy and the MPR-Statistical Complexity for each of the 112 samples in Lapointe et al. .
Metastatic samples have typically lower values of Normalized Shannon Entropy than normal samples and prostate cancer primary tumors. The reduction in Normalized Shannon Entropy indicates that there exists a significant reduction on the expression of a large number of genes, or that the gene profile of metastatic samples has a more “peaked” distribution (due to the upregulation of a selected subset of genes). Both possibilities just cited are not mutually exclusive. We also note that neither the Normalized Shannon Entropy, nor the MPR-Statistical Complexity (as a single unsupervised quantifier), can help differentiate between tumor and normal samples, indicating that other Information Theory quantifiers are required for this discrimination.
Figure 2
Figure 2. M-Normal against M-Metastases for the samples in Lapointe et al. .
We have seen in Figure 1, that the Normalized Shannon Entropy and the MPR-Statistical Complexity differentiate the metastatic samples from the normal samples, but that these two measures can not help to discriminate the primary tumors from the normals. We show here the results of two statistical complexity measures which are in some sense supervised (i.e. dependent on the dataset being interrogated). We call these two stastical mesured M-Normal and M-Metastases. They have the same functional form of the MPR-Statistical Complexity, but they use the average normal and average metastatic profile as probability distribution functions of reference. As a consequence, the M-normal and M-metastases are directly proportional to the Jensen-Shannon divergences with the normal (and respectively with the metastatic) gene expression profile. It is remarkable that, although we are using these end processes only (from Lapointe et al's, dataset of 5,153 probes×112 samples), most of the primary tumor samples appear as a transitional state between the normal and metastatic group. This is remarkable since the primary tumor samples were not used to define the M-normal and M-metastases measures and, in principle, the samples could have been located anywhere in the (M-normal, M-metastases)-plane. Computation of correlations of the probe expressions values can help us identify genes which are highly correlated with a divergence from the normal expression profile and, at the same time, converge towards the average metastatic profile.
Figure 3
Figure 3. A scatter plot of each of the 5,123 probes of the dataset contributed by Lapointe et al.
We have computed the Pearson and Spearman correlation of each probe expression (across samples) with the Jensen-Shannon divergence of each of the samples with the average metastasis profile (these values are called JSM2-Pearson and JSM2-Spearman in the accompanying Excel file provided). One of the clinically most relevant markers for prostate cancer (KLK3/PSA) together with FOS, CCL2/MCP-1, SOX9 and a probe for LOC51334 (mesenchymal stem cell protein DSC54) appear with highly negative Spearman and Pearson correlations values, indicating that they are negatively correlated with the Jensen-Shannon divergence from the average metastatic profile. BRCA2 (highly regarded as a tumor suppressor in cancer research), FOXM1 (a putative regulator of the mitotic program and the control of chromosomal stability [49]), and CDKN2D (a CDK4 inhibitor) in opposition with KLK3/PSA, seems to be positively correlated. As will be seen later in the analysis of the melanoma dataset, these positive correlations with the Jensen-Shannon divergence from the average metastatic profile indicate a possible dysregulation of these critical processes for which these genes have key roles.
Figure 4
Figure 4. Scatter plot of the samples of the melanoma dataset contributed by Haqq et al.
It presents the MPR-Statistical Complexity of each sample as a function of its Normalized Shannon Entropy. This dataset contains information of 14,737 probes and 37 samples. The samples include 3 normal skin, 9 nevi, 6 primary melanoma and 19 melanoma metastases (these samples are 5 of melanoma metastasis ype I and 14 of type II, as labelled by Haqq et al). Following Haqq et al's original classification, the two types of melanoma metastases they identified are presented with different color coding. The plot illustrates that in this case, the Normalized Shannon Entropy does not help to differentiate the normal to metastatic progression (as it happened in the case of prostate cancer). We will show in Figure 5 that the modified statistical complexities M-skin and M-metastasis allow visualizing a clearer transitional pattern.
Figure 5
Figure 5. Scatter plot of the melanoma sample dataset of Haqq et al.
This is the same set of samples of Figure 4 and we have used the same color coding. We are now using the modified statistical complexity measures M-skin and M-metastasis II. As expected, normal skin samples (in green) have a low value of the M-skin measure. Interestingly, most of the nevi samples (in yellow) have an intermediate value of the M-skin measure, and most of the primary and metastatic samples have even larger values of M-skin. This result, together with our observation and analysis of Figure 4, indicate that the Jensen-Shannon divergence of melanoma samples from the normal skin profile may be a relevant measure to quantitatively analyse progression even when the whole gene expression dataset is used. We observe that, although the M-metastasis II measure has used all the samples labelled as Type 2 (in Haqq et al.'s original contribution), their position in this plane shows two different clusters. This may indicate that a further heterogeneity may exist in this subgroup, a fact that warrants further study with a larger group of samples.
Figure 6
Figure 6. A scatter plot of the Spearman correlation of 14,737 probes in the Haqq et al. melanoma dataset.
We have computed the Jensen-Shannon divergence of each sample with the normal skin average. We then computed the correlation of each individual probe expression with the Jensen-Shannon divergence of each sample. As this correlation is computed on all samples, the resulting value (x-axis) was denoted as JSM0A-Spearman. Analogously, we compute the Jensen-Shannon divergence of each sample with the average metastastic profile and we also compute the correlation of each probe with this measure (y-axis). The position of one probe corresponding to the TP63 gene (Tumor protein p63, keratinocyte transcription factor KET), AA455929, is highlighted. The expression of this probe has a relatively high negative correlation with the Jensen-Shannon divergence of the normal skin type (JSM0-Spearman = −0.63632) while at the same time is has a positive correlation with the Jensen-Shannon divergence of the metastasis profile (JSM5 = 0.62138). The first probe that presents an opposite behaviour is one for ADA (Adenosine deaminase), AA683578. Probes for SPP1 (Secreted phosphoprotein 1 or Osteopontin) and PLK1 (Polo-like kinase 1 or Drosophila) are also highlighted. While PLK1 is currently less recognized as a biomarker in melanoma research, the importance of SPP1 in cutaneous pathology , , , and in particular in melanoma , , , , , , , , , , , , , , , , , , , , , , , , , , , , , , , is increasing. Using a 5-biomarker panel that included SPP1, Kashani-Sabet et al. used tissue microarrays on 693 melanocytic neoplasms to show that SPP1 expression collaborates significantly improving the detection of high percentage of melanomas arising in a nevus, Spitz nevi, dysplastic nevi and misdiagnosed lesions . Like in the case of prostate cancer (Figure 3, in which KLK3/PSA - Prostate Specific Antigen was highlighted), our method allows the detection of important biomarkers with a high degree of concordance with current biological understanding of metastatic processes.
Figure 7
Figure 7. Scatter plot showing the expression of the probe corresponding to ADA (Adenosine deaminase), AA683578 (y-axis) and TP63 (Tumor protein p63), AA455929 (x-axis).
All the samples that have TP63 expression are normal or nevi, with two primary melanomas still preserving TP63 expression but with higher ADA. The trend reverses for the rest of the primary melanoma samples and the metastatic ones, which all express ADA but not TP63.
Figure 8
Figure 8. Heat map of the expression of 27 probes with genes annotated showing functions on cell adhesion, cell-cell communication, tight junction mechanisms and epithelial cell polarity.
The average expression of the skin samples is shown in green. In yellow, the nevi samples, showing that some of them have a reduced average expression. The primary melanomas have a mixed behaviour (orange columns) with four of them having almost zero of negative average expression. The metastatic samples (columns in red) have all a negative average expression. Overall the figure indicates a progression, from the positive average expression of this gene panel for nevi and normal skin samples, towards negative expression values of the metastatic samples, “passing” through the mixed behaviour present in primary melanomas.
Figure 9
Figure 9. Shows the average expression of PKP1 and JUP.
The joint expression of the probe for PKP1 (Plakophilin 1 - ectodermal dysplasia/skin fragility syndrome - NM_000299) and the probe for JUP (Junction plakoglobin - BX648177), as added values on the x-axis, against the expression of the probe for DSP (Desmoplakin - NM_004415 Hs.519873) on the y-axis. There is a clear common downregulation trend of these biomarkers from the normal skin (Skin) to the nevi (MN) and to the primay melanoma and metastic melanoma samples (PM and MM respectively).
Figure 10
Figure 10. Expression of a probe for CLDN1 (Claudin 1) (y-axis) as a function of a probe for Aquaporin 3 (x-axis).
Other members of the aquaporin family of proteins have a similar behaviour. AQP3, together with CLDN1 are key components of the tight junction complexes of the epidermis and their joint loss of expression seem to be related to a transition to a more malignant phenotype. We use the same color coding as Figure 9.
Figure 11
Figure 11. Heat map of the expression of 38 gene probes annotated with functions on cell proliferation, in particular cell motility, mitotic cell cycle, nuclear division, and specifically, M phase of mitotic cell cycle.
We have used the same convention we employed in Figure 8: in green, the normal skin samples; in yellow, the nevi samples; the primary melanoma samples (in orange) show increased expression for most of these biomarkers. This may indicate that the upregulation of genes involved in these processes is an earlier event (it occurs as a common feature in all the primary melanoma samples) while modifications to cell adhesion, cell-cell communication, tight junction mechanisms and epithelial cell polarity occur later (primary melanomas in Figure 4 show a transition). Finally, the metastatic samples (in red) show some heterogeneity, but overall provide an increased expression. The average expression of this panel could be a good indicator of the transition from nevi to a malignant phenotype, while the panel of Figure 8 can complement the information indicatingthe onset of tissue dedifferentiation processes.
Figure 12
Figure 12. Scatter plot of the samples in the prostate cancer dataset contributed by True et al., presenting the MPR-Statistical Complexity of each sample as a function of its Normalized Shannon Entropy.
The dataset contains the expression of 13,188 probes and 31 samples. The samples include 11 samples labelled ‘Gleason 3’ (in green), 12 ‘Gleason 4’ samples, and 8 ‘Gleason 5’ (in red). Two samples seem to be outliers to a generic trend, which is somewhat expected. We do expect samples with a ‘Gleason 3’ label to have higher values of Normalized Shannon Entropy. This is indeed the case, no sample with a ‘Gleason 3’ label has a value of Normalized Shannon Entropy lower than 0.985, while 14 samples corresponding to samples which are either ‘Gleason 4’ or ‘Gleason 5’ have values smaller than that threshold. In agreement with some of the caveats discussed by True et al., there exist a group of samples that, irrespective of their label, have similar values of Normalized Shannon Entropy (near 0.992). Samples 02_003E and 03_063 seem to be outliers to this trend, and in the case of 03_063 the sample is not even close to a hypothetical linear fit which seems to be the norm for all the samples. Figure 13 will provide further evidence that may indicate that these two samples are outliers or not to the overall trend.
Figure 13
Figure 13. Scatter plot of the samples in the prostate cancer dataset contributed by True et al.
We have used the same color coding convention we have used in Figure 12. We plot the values of two modified statistical complexities, which we will call M-Gleason 3 and M-Gleason 5. Instead of using the equiprobable distribution as our probability distribution of reference (for the computation of the Jensen-Shannon Divergence of the gene expression profile to this distribution), as required for the MPR-Statistical Complexity calculation, we used a different one. For the M-Gleason 3, the probability distribution of the reference is obtained averaging all the probability distributions of the samples that have been labelled as Gleason 3 (analogously, we calculated M-Gleason 5). This is analogous to our approach in melanoma (Figure 5) in which we used normal and metastatic samples as reference sets for a modified statistical complexity. We observe that, even in this case, 02_003E and 03_063 continue to appear as outliers. In addition to the evidence, we have observed that the deletion of these two samples did not significantly alter the identification of biomarkers.
Figure 14
Figure 14. A region of interest of Figure 12 containing the 29 samples to be used in the analysis.
Due to the characteristics of this microarray dataset and the experiment setting, the Normalized Shannon Entropy correlates well with the established clinical notions of malignancy (high Gleason patterns). Most Gleason pattern 5 samples (in red) have lower values of Normalized Shannon Entropy than Gleason pattern 3 samples.
Figure 15
Figure 15. A plot showing that restricting our analysis to 29 samples does not have a major negative impact or changes in the computation of modified statistical complexities.
Figure 16
Figure 16. A scatter plot of Spearman versus Pearson correlation values of the probe expression of 13,188 probes in True et al.'s prostate cancer dataset with the Normalized Shannon Entropy values of the samples.
The identification of probes that best correlate, either positively or negatively, with the values of the Normalized Shannon Entropy of the samples highlights some of the most important biomarkers in prostate cancer, like CDKN2C, MAOA, CDK4, CDK7, AMACR, TP53 and BRCA1 (with an upregualtion trend from their normal expression values). The list includes others that present a downregulation from their normal values, like LMNA, CD40, and SFPQ. These genes are discussed in detail in the context of current prostate cancer research in the main text. This result has revealed some of the most relevant biomarkers of prostate cancer progression (AMACR, MAOA, CDK4, TP53, BRCA1, STAT3), and some unexpected new complementary biomarkers (i.e. SFPQ, CD40, STAT3, LMNA, CD59 etc).
Figure 17
Figure 17. Heat map showing the expression of four of the six probes corresponding to aquaporins (AQP1, AQP3, AQP5, and AQP9) in Haqq et al.'s melanoma dataset.
Primary melanaoma samples (annotated in green) and benign nevi (in yellow) show higher expression values. Primar melanoma (in orange) show a mixed behaviour and metastaic melanoma samples (in red) show in comparision that their expression is remarkably lower. We highlight the similarity of this finding with Figure 8, in which we have shown the same behaviour for a group of genes functionally annotated as being involved in cell adhesion, cell-cell communication, tight junction mechanisms and epithelial cell polarity. Metastatic melanoma samples, in comparison, show remarkably reduced values of the joint expression of these four probes, indicating the possibility of an impaired function of these highly selective mechanisms.
Figure 18
Figure 18. Heat map and stacked values showing the expression of the probe that correspond to AQP1 and AQP3 in Lapointe et al's prostate cancer dataset (Samples ordered by their total average value).
Most of the control samples have a positive joint expression value (in green). A reduction is observed in primary prostate tumor samples (in yellow), with more than one half of the samples now having negative values. On the rightmost part of the figure, most of the lymph node metastasis samples (in red) have a strong negative total joint expression of these two biomarkers.
Figure 19
Figure 19. The stacked average gene expression of probes corresponding to BRCA1 and TERF2 (telomeric repeat binding factor 2) in True et al's prostate cancer dataset.
The first group of samples (1 to 9 in green) correspond to Gleason 3 pattern, indicating that most of the samples in this group have no significantly reduced expression of this pair of genes. The second group of columns (10 to 21 in yellow) correspond to Gleason 4 patterns and the last 8 columns (22 to 29 in red) correspond to Gleason 5 samples. A very recent study by Ballal et al. have linked BRCA1, to telomere length and maintenance and its loss from the telomere in response to DNA damage (see also [721]). There is an increasing trend of dowregulation, so it would be interesting to evaluate if indeed this pair of proteins could be an early marker of dowregulation useful to evaluate samples with Gleason pattern 2, or if may constitute a biomarker useful to distinguish a prostate cancer subtype.
Figure 20
Figure 20. Non-coding RNAs and prostate cancer.
We present again a scatter plot of Spearman versus Pearson correlation values of the probe expression of 13,188 probes in True et al's prostate cancer dataset with the Normalized Shannon Entropy values of the samples. All blue dots correspond to one of the probes, but the only difference with Figure 16 is that we have now highlighted the position of s ome probes which have been annotated as corresponding to “non-coding RNAs”. In particular, we highlight those of MALAT1 (Metastasis associated lung adenocarcinoma transcript 1, (non-protein coding)), SNORA60 (small nucleolar RNA, H/ACA box 60); both increasingly downregulated, SNHG1 (small nucleolar RNA host gene 1 (non-protein coding)) and SNHG8 (small nucleolar RNA host gene 8 (non-protein coding)). The probes for MALAT1/MALAT-1 , , , , , , , , , , , , , have a very conspiquous position, which we could judge a priori to be equivalent in relevance to those of the previously discussed roles of SFPQ, CD40, BRCA1, and TP53 (see Figure 16). MALAT1 has been recently pointed as a biomarker in primary human lobular breast cancer as a result of an analysis of over 132,000 Roche 454 high-confidence deep sequencing reads. Within the thousands of novel non-coding transcripts of the breast cancer transcriptome, Guffanti al., identified more than three hundred reads corresponding to MALAT1 . This non-coding RNA, first identified in 2003 in non-small cell lung cancer, was shown to be highly expressed (relative to GAPDH) in lung, pancreas and prostate, but not in other tissues including muscle, skin, stomach, bone marrow, saliva, thyroid and adrenal glands, uterus and fetal liver (see figure four of Ref. [758]). Our results indicate that the reduction of expression of some non-coding RNAs, in particular of MALAT-1, and SNORA60 with respect to their normal expression in prostate, as well as the upregulation of SNHG8 and SNHG1 should be monitored as useful biomarkers to track disease staging and progression to a more malignant phenotype. Interestingly enough, a study published in 2006 by Nadminty et al. has shown that KLK3/PSA modulates several genes, reporting a 16.5 fold downregulation of MALAT1 . While these results have been obtained using the human osteosarcoma cell line SaOS-2, our results indicate that MALAT1 expression in the normal prostate and in cancer cells could also be considered as a relevant biomarkers to be tested in the future.
Figure 21
Figure 21. Normalized Shannon Entropy values (H) of the samples from Table 3 .
Sample 4 has the largest attainable value since the expression of all probes is the same. Samples 1 and 2, which have the same set of expression values, although in different probes, have the same value of Normalized Shannon Entropy. As a consequence, there is a need for another quantifier of gene expression to address the permutational indistinguishability of these two expression profiles. The Jensen-Shannon divergence provides a natural alternative (see Table 4).
Figure 22
Figure 22. MPR-Statistical Complexity as a function of the Normalized Shannon Entropy for the example dataset from Table 3 .
The MPR-Statistical complexity is proportional to the Normalized Shannon Entropy (labelled ‘MPR’, y-axis) of a sample and the Jensen-Shannon divergence of the sample and a hypothetical sample with an equiprobability distribution of gene expression.

Similar articles

Cited by

References

    1. Hanahan D, Weinberg RA. The hallmarks of cancer. Cell. 2000;100:57–70. - PubMed
    1. Wong DJ, Segal E, Chang HY. Stemness, cancer and cancer stem cells. Cell Cycle. 2008;7 - PubMed
    1. Glinsky GV. “Stemness” genomics law governs clinical behavior of human cancer: implications for decision making in disease management. J Clin Oncol. 2008;26:2846–2853. - PubMed
    1. Ben-Porath I, Thomson MW, Carey VJ, Ge R, Bell GW, et al. An embryonic stem cell-like gene expression signature in poorly differentiated aggressive human tumors. Nat Genet. 2008;40:499–507. - PMC - PubMed
    1. Maniccia AW, Lewis C, Begum N, Xu J, Cui J, et al. Mitochondrial localization, ELK-1 transcriptional regulation and growth inhibitory functions of BRCA1, BRCA1a, and BRCA1b proteins. J Cell Physiol. 2009;219:634–641. - PMC - PubMed

Publication types

MeSH terms

Substances