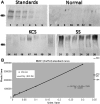
MUC1 expression in Sjogren's syndrome, KCS, and control subjects
- PMID: 20806091
- PMCID: PMC2927371
MUC1 expression in Sjogren's syndrome, KCS, and control subjects
Abstract
Purpose: To quantify and compare human mucin 1 (MUC1) protein and mRNA expression in tears and conjunctival epithelial cells collected from Sjogren's syndrome (SS), non-Sjogren's keratoconjunctivitus sicca (KCS) and non-dry eyed (NDE) control subjects.
Methods: Seventy-six subjects were recruited for this study: 25 SS (confirmed via American-European Consensus Criteria 2002), 25 KCS (confirmed by symptoms and Schirmer scores < or = 10 mm) and 26 NDE. Tears were collected using an eye-wash technique. Impression cytology was used to gather protein and mRNA from conjunctival epithelial cells. Soluble and membrane bound MUC1 were quantified via western blotting and MUC1 mRNA was quantified by real time qPCR.
Results: The SS group demonstrated significantly higher concentrations of soluble MUC1 (0.12 +/- 0.11 [SS]; 0.013 +/- 0.02 [KCS; p=0.001]; 0.0023 +/- 0.0024 [NDE; p<0.001]) and MUC1 mRNA (3.18 +/- 1.44 [SS]; 1.79 +/- 1.18 [KCS; p<0.05]; 1.60 +/- 0.74 [NDE; p<0.05]) compared to both KCS and NDE groups. Soluble MUC1 expression was also higher in the KCS group compared to the NDE group (p=0.02), where as MUC1 mRNA expression was similar in both KCS and NDE groups. Membrane bound MUC1 expression differed only between the SS and NDE groups (0.005 +/- -0.003 [SS]; 0.003 +/- 0.002 [NDE; p=0.002]).
Conclusions: These results demonstrate that SS subjects express greater quantities of MUC1 protein and mRNA compared to both KCS and control subjects. Increased soluble MUC1 expression was also found in KCS subjects compared to controls. Membrane bound MUC1 was present in higher concentration in SS versus NDE only. These significant changes in MUC1 expression may represent compensatory or protective responses to chronic insult to the ocular surface.
Figures


Similar articles
-
MUC16 expression in Sjogren's syndrome, KCS, and control subjects.Mol Vis. 2008;14:2547-55. Epub 2008 Dec 30. Mol Vis. 2008. PMID: 19122828 Free PMC article.
-
Quantification of conjunctival TNF-α in aqueous-deficient dry eye.Optom Vis Sci. 2014 Feb;91(2):156-62. doi: 10.1097/OPX.0000000000000133. Optom Vis Sci. 2014. PMID: 24343449
-
Tear lipocalin and lysozyme in Sjögren and non-Sjögren dry eye.Optom Vis Sci. 2008 Aug;85(8):661-7. doi: 10.1097/OPX.0b013e318181ae4f. Optom Vis Sci. 2008. PMID: 18677232
-
Evaluation and differential diagnosis of keratoconjunctivitis sicca.J Rheumatol Suppl. 2000 Dec;61:11-4. J Rheumatol Suppl. 2000. PMID: 11128698 Review.
-
Ocular manifestations of Sjögren's syndrome: keratoconjunctivitis sicca.Rheum Dis Clin North Am. 1992 Aug;18(3):591-608. Rheum Dis Clin North Am. 1992. PMID: 1496163 Review.
Cited by
-
TFOS DEWS II Tear Film Report.Ocul Surf. 2017 Jul;15(3):366-403. doi: 10.1016/j.jtos.2017.03.006. Epub 2017 Jul 20. Ocul Surf. 2017. PMID: 28736338 Free PMC article. Review.
-
Dry eye disease and microbial keratitis: is there a connection?Ocul Surf. 2013 Apr;11(2):75-92. doi: 10.1016/j.jtos.2012.12.002. Epub 2013 Jan 29. Ocul Surf. 2013. PMID: 23583043 Free PMC article. Review.
-
Quantification of MUCIN 1, cell surface associated and MUCIN16, cell surface associated proteins in tears and conjunctival epithelial cells collected from postmenopausal women.Mol Vis. 2013 May 6;19:970-9. Print 2013. Mol Vis. 2013. PMID: 23687433 Free PMC article.
-
Comparison of mucin levels at the ocular surface of visual display terminal users with and without dry eye disease.BMC Ophthalmol. 2023 Apr 28;23(1):189. doi: 10.1186/s12886-023-02931-3. BMC Ophthalmol. 2023. PMID: 37106448 Free PMC article.
-
Dry Eye Management: Targeting the Ocular Surface Microenvironment.Int J Mol Sci. 2017 Jun 29;18(7):1398. doi: 10.3390/ijms18071398. Int J Mol Sci. 2017. PMID: 28661456 Free PMC article. Review.
References
-
- Dilly PN. Structure and function of the tear film. Adv Exp Med Biol. 1994;350:239–47. - PubMed
-
- Pflugfelder SC, Solomon A, Stern ME. The diagnosis and management of dry eye: a twenty-five-year review. Cornea. 2000;19:644–9. - PubMed
-
- Dilly PN. Contribution of the epithelium to the stability of the tear film. Trans Ophthalmol Soc U K. 1985;104:381–9. - PubMed
-
- Gipson I, Inatomi T. Cellular origins of mucins of the ocular surface tear film. In (eds). In: Sullivan D, Dartt D, Meneray M, editors. Lacrimal Gland, Tear Film and Dry Eye Syndromes 2. New York: Plenum Press; 1998. p. 221–7.
-
- Holly FJ. Formation and rupture of the tear film. Exp Eye Res. 1973;15:515–25. - PubMed
MeSH terms
Substances
LinkOut - more resources
Full Text Sources
Other Literature Sources
Medical
Research Materials
Miscellaneous
