

Fast human brain magnetic resonance responses associated with epileptiform spikes
- PMID: 20806355
- PMCID: PMC3681097
- DOI: 10.1002/mrm.22561
Fast human brain magnetic resonance responses associated with epileptiform spikes
Abstract
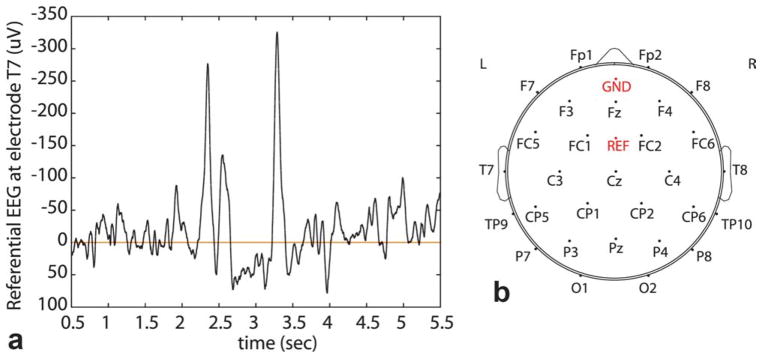
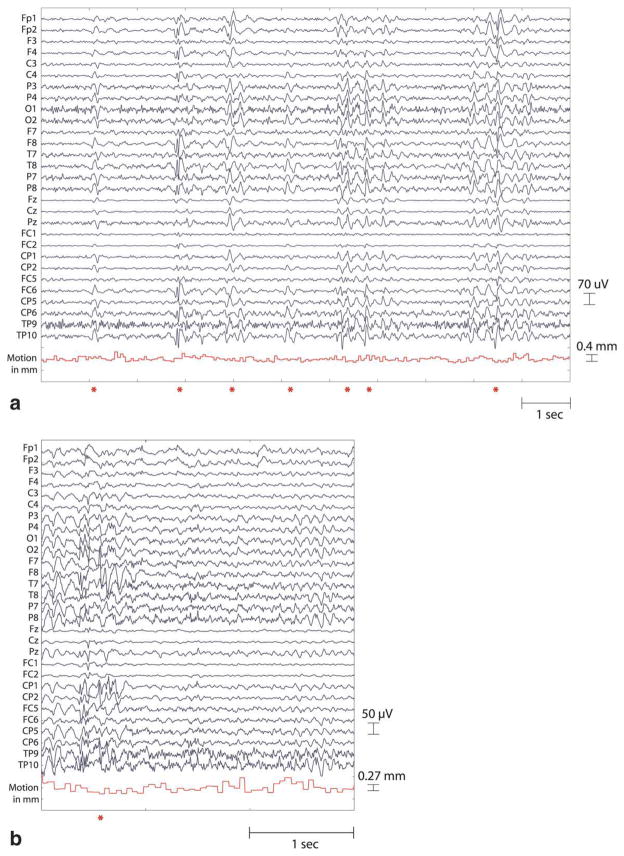
Neuronal currents produce local electromagnetic fields that can potentially modulate the phase of the magnetic resonance signal and thus provide a contrast mechanism tightly linked to neuronal activity. Previous work has demonstrated the feasibility of direct MRI of neuronal activity in phantoms and cell culture, but in vivo efforts have yielded inconclusive, conflicting results. The likelihood of detecting and validating such signals can be increased with (i) fast gradient-echo echo-planar imaging, with acquisition rates sufficient to resolve neuronal activity, (ii) subjects with epilepsy, who frequently experience stereotypical electromagnetic discharges between seizures, expressed as brief, localized, high-amplitude spikes (interictal discharges), and (iii) concurrent electroencephalography. This work demonstrates that both MR magnitude and phase show large-amplitude changes concurrent with electroencephalography spikes. We found a temporal derivative relationship between MR phase and scalp electroencephalography, suggesting that the MR phase changes may be tightly linked to local cerebral activity. We refer to this manner of MR acquisition, designed explicitly to track the electroencephalography, as encephalographic MRI (eMRI). Potential extension of this technique into a general purpose functional neuroimaging tool requires further study of the MR signal changes accompanying lower amplitude neuronal activity than those discussed here.
Copyright © 2010 Wiley-Liss, Inc.
Figures


Similar articles
-
An empirical investigation of motion effects in eMRI of interictal epileptiform spikes.Magn Reson Imaging. 2011 Dec;29(10):1401-9. doi: 10.1016/j.mri.2011.03.007. Epub 2011 May 8. Magn Reson Imaging. 2011. PMID: 21550748 Free PMC article.
-
EEG-triggered functional MRI of interictal epileptiform activity in patients with partial seizures.Brain. 1999 Sep;122 ( Pt 9):1679-88. doi: 10.1093/brain/122.9.1679. Brain. 1999. PMID: 10468507
-
With or without spikes: localization of focal epileptic activity by simultaneous electroencephalography and functional magnetic resonance imaging.Brain. 2011 Oct;134(Pt 10):2867-86. doi: 10.1093/brain/awr156. Epub 2011 Jul 12. Brain. 2011. PMID: 21752790 Free PMC article.
-
Interictal electromagnetic source imaging in focal epilepsy: practices, results and recommendations.Curr Opin Neurol. 2008 Aug;21(4):437-45. doi: 10.1097/WCO.0b013e3283081e23. Curr Opin Neurol. 2008. PMID: 18607204 Review.
-
Interictal oscillations and focal epileptic disorders.Eur J Neurosci. 2018 Oct;48(8):2915-2927. doi: 10.1111/ejn.13628. Epub 2017 Jul 18. Eur J Neurosci. 2018. PMID: 28644911 Review.
Cited by
-
Toward direct MRI of neuro-electro-magnetic oscillations in the human brain.Magn Reson Med. 2019 Jun;81(6):3462-3475. doi: 10.1002/mrm.27654. Epub 2019 Jan 16. Magn Reson Med. 2019. PMID: 30652351 Free PMC article.
-
Can MRI Be Used as a Sensor to Record Neural Activity?Sensors (Basel). 2023 Jan 25;23(3):1337. doi: 10.3390/s23031337. Sensors (Basel). 2023. PMID: 36772381 Free PMC article. Review.
-
Functional conductivity imaging: quantitative mapping of brain activity.Phys Eng Sci Med. 2024 Dec;47(4):1723-1738. doi: 10.1007/s13246-024-01484-z. Epub 2024 Sep 11. Phys Eng Sci Med. 2024. PMID: 39259483 Free PMC article.
-
Is it possible to detect dendrite currents using presently available magnetic resonance imaging techniques?Med Biol Eng Comput. 2012 Jul;50(7):651-7. doi: 10.1007/s11517-012-0899-3. Epub 2012 Mar 24. Med Biol Eng Comput. 2012. PMID: 22447349 Free PMC article.
-
The movement of a nerve in a magnetic field: application to MRI Lorentz effect imaging.Med Biol Eng Comput. 2014 May;52(5):491-8. doi: 10.1007/s11517-014-1153-y. Epub 2014 Apr 12. Med Biol Eng Comput. 2014. PMID: 24728667 Free PMC article.
References
-
- Logothetis NK, Wandell BA. Interpreting the BOLD signal. Annu Rev Physiol. 2004;66:735–769. - PubMed
-
- Lopes da Silva F. Functional localization of brain sources using EEG and/or MEG data: volume conductor and source models. Magn Reson Imaging. 2004;22:1533–1538. - PubMed
-
- Bodurka J, Bandettini PA. Toward direct mapping of neuronal activity: MRI detection of ultraweak, transient magnetic field changes. Magn Reson Med. 2002;47:1052–1058. - PubMed
-
- Konn D, Gowland P, Bowtell R. MRI detection of weak magnetic fields due to an extended current dipole in a conducting sphere: a model for direct detection of neuronal currents in the brain. Magn Reson Med. 2003;50:40–49. - PubMed
Publication types
MeSH terms
Grants and funding
LinkOut - more resources
Full Text Sources
Other Literature Sources
Medical
