. 2010 Sep;64(3):680-7.
doi: 10.1002/mrm.22459.

Characterization of 1H NMR signal in human cortical bone for magnetic resonance imaging

Affiliations

Characterization of 1H NMR signal in human cortical bone for magnetic resonance imaging

R Adam Horch et al. Magn Reson Med. 2010 Sep.

Abstract

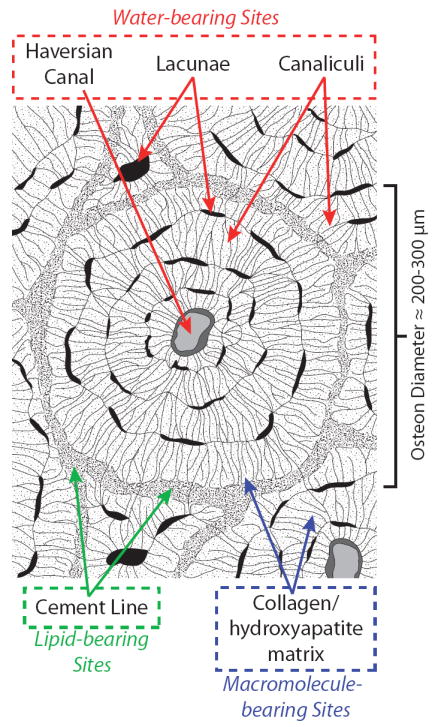
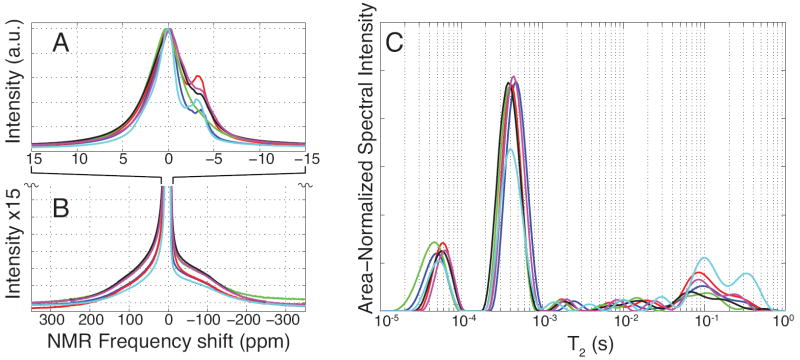
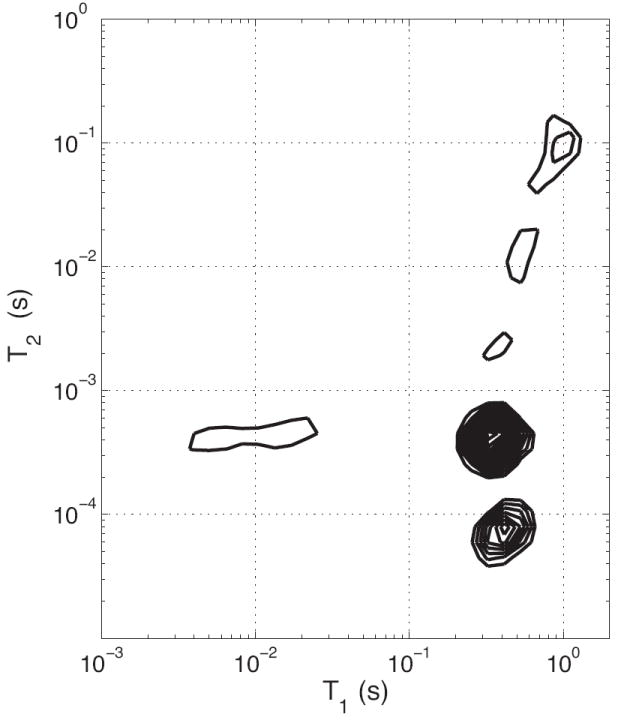
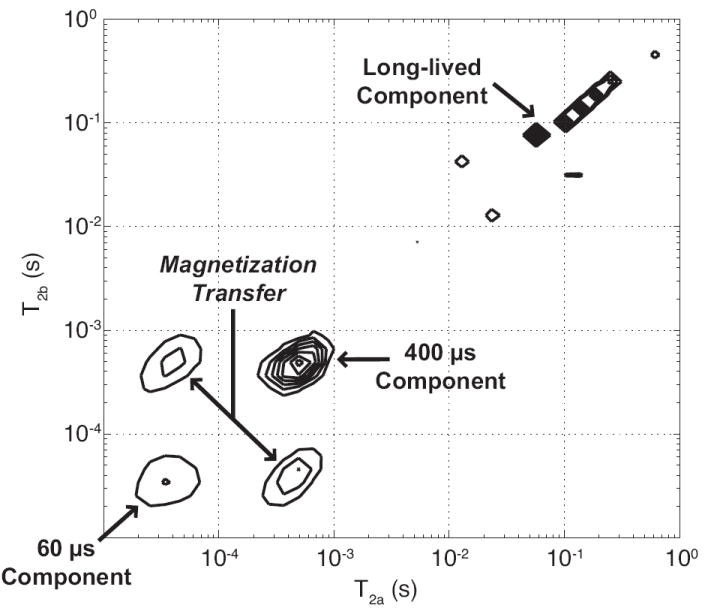
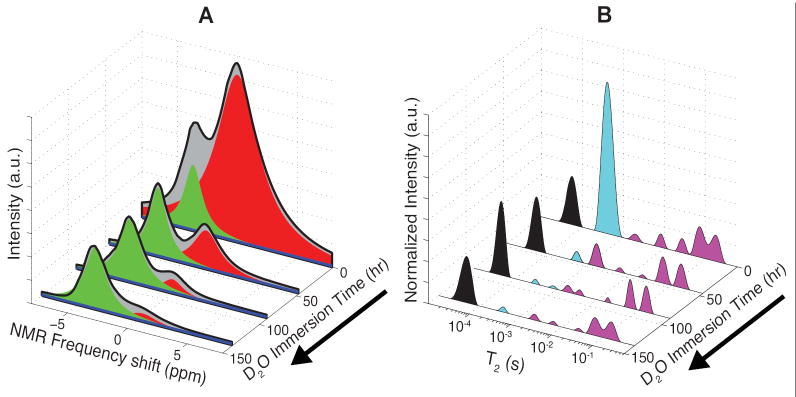
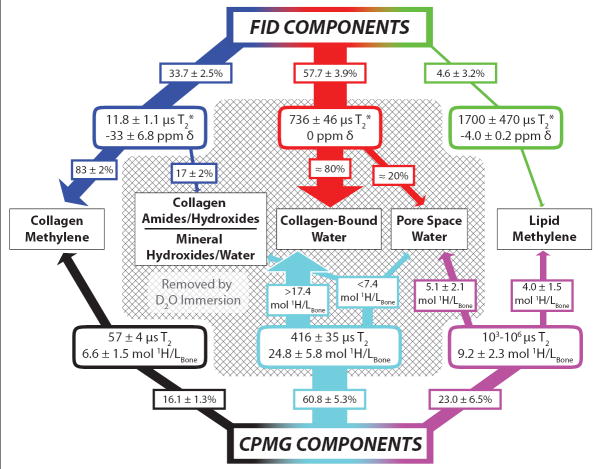
Recent advancements in MRI have enabled clinical imaging of human cortical bone, providing a potentially powerful new means for assessing bone health with molecular-scale sensitivities unavailable to conventional X-ray-based diagnostics. In human cortical bone, MRI is sensitive to populations of protons ((1)H) partitioned among water and protein sources, which may be differentiated according to intrinsic NMR properties such as chemical shift and transverse and longitudinal relaxation rates. Herein, these NMR properties were assessed in human cortical bone donors from a broad age range, and four distinct (1)H populations were consistently identified and attributed to five microanatomical sources. These findings show that modern human cortical bone MRI contrast will be dominated by collagen-bound water, which can also be exploited to study human cortical bone collagen via magnetization transfer.


Figures

FIGURE 1
FIGURE 1
Bone matrix schematic. Expected biophysical distribution of osteonal water, lipid, and macromolecule-bearing proton sites in human cortical bone are identified in red, green, and blue, respectively. The primary nano- and microstructures housing each of these sites are given in dashed boxes.
FIGURE 2
FIGURE 2
Wideline NMR and multiexponential T2 spectroscopy of human cortical bone specimens. NMR spectroscopy of human cortical bone specimens over narrow (A) and broad (B) bandwidths generally showed three frequency components in all samples: an off-resonant, narrow-band frequency component at -4.0±0.2 ppm (fat shifted) and on-resonant narrow-band and broad-band components. Spectra in (B) are magnified 15-fold in the vertical axis of (A) and are vertically cropped for display purposes. Multiexponential T2 spectroscopy of human cortical bone (C) reveals two well-defined T2 pools at 57±4 μs and 416±35 μs and a broad distribution of T2 components spanning 1 ms to 1000 ms. All spectra were normalized to maximum intensity (A, B) or total integrated area (C).
FIGURE 3
FIGURE 3
2D T1-T2 Spectra. Typical results from IR-CPMG data are shown, wherein the T1 relaxation time(s) for each T2 component may be identified after a 2D inverse Laplace transform. Note that all T2 components are monoexponential in T1 except for the 400 μs T2, which results from magnetization transfer with a shorter-lived T2 component.
FIGURE 4
FIGURE 4
2-D exchange spectroscopy (REXSY) representative of all HCB specimens. Each of the three T2 components appear on the main diagonal (running lower-left to upper-right), which represents stationary nuclear spins that do not transit between pools during the 200 ms REXSY mixing period and thus maintain a fixed T2. Off-diagonal cross peaks, observed between the two short-lived T2 components, indicate spins that exchange via magnetization transfer mechanisms. Thus, the protons relaxing with T2 ≈ 60 μs and ≈ 400 μs are in molecular contact during the mixing period but effectively remain isolated from the long-lived protons.
FIGURE 5
FIGURE 5
Effects of D2O immersion on resonance and multiexponential T2 spectra of HCB specimens. Resonance (A) and T2 spectra (B) are shown at various time points for one representative HCB specimen undergoing D2O immersion. Resonance spectra, shown in grey and black, were fitted to the sum of three lorentzian components, which are overlaid in red, blue, and green. T2 spectra are divided into ≈ 60 μs (black), ≈ 400 μs (cyan), and long-lived (magenta) components for comparison to the three resonant components.
FIGURE 6
FIGURE 6
Postulated biophysical origins of NMR signal relaxation components in HCB. The signal contributions of FID (top) and CPMG (bottom) components to various biophysical proton sources (middle) are indicated by connecting arrows with the same color scheme as in FIGURE 5. FID and CPMG signals are first decomposed into three discrete T2* and T2 relaxation components, respectively, with relevant parameters shown in rounded rectangles. Via D2O immersion studies and 2-D exchange spectroscopy experiments, these relaxation components can then be assigned to specific proton sources (see Discussion). All components removed by D2O immersion are enclosed in the shaded area. If a component arises from more than one proton source, the pendant arrows transect approximate signal fractions (%) or proton concentrations (mol 1H/Lbone) to indicate the component’s distribution among sources.

References

    1. Johnell O, Kanis JA, Oden A, Johansson H, De Laet C, Delmas P, Eisman JA, Fujiwara S, Kroger H, Mellstrom D, Meunier PJ, Melton LJ, O’Neill T, Pols H, Reeve J, Silman A, Tenenhouse A. Predictive value of BMD for hip and other fractures. J Bone Miner Res. 2005;20(7):1185–1194. - PubMed
    1. Bembey AK, Bushby AJ, Boyde A, Ferguson VL, Oyen ML. Hydration effects on the micro-mechanical properties of bone. J Mater Res. 2006;21(8):1962–1968.
    1. Nyman JS, Roy A, Shen XM, Acuna RL, Tyler JH, Wang XD. The influence of water removal on the strength and toughness of cortical bone. J Biomech. 2006;39(5):931–938. - PMC - PubMed
    1. Yan JH, Daga A, Kumar R, Mecholsky JJ. Fracture toughness and work of fracture of hydrated, dehydrated, and ashed bovine bone. J Biomech. 2008;41(9):1929–1936. - PubMed
    1. Sasaki N, Enyo A. Viscoelastic properties of bone as a function of water-content. J Biomech. 1995;28(7):809–815. - PubMed

Publication types